logo
Data from Caution Ahead

Data - March 2014

Data from Caution Ahead

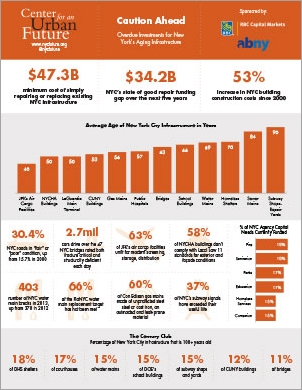
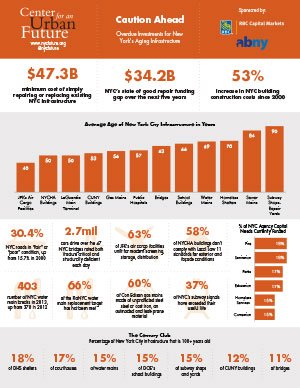
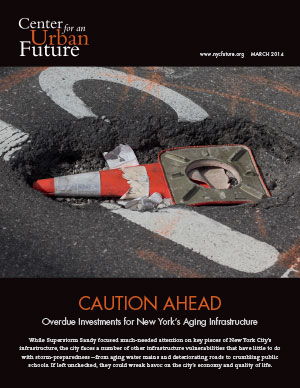
Charts and tables from our Caution Ahead report which found that while Superstorm Sandy focused much-needed attention on key pieces of New York City’s infrastructure, the city faces a number of other infrastructure vulnerabilities that have little to do with storm-preparedness—from aging water mains and deteriorating roads to crumbling public schools. If left unchecked, they could wreak havoc on the city’s economy and quality of life.

Tags: economic growth economic opportunity boroughs infrastructure


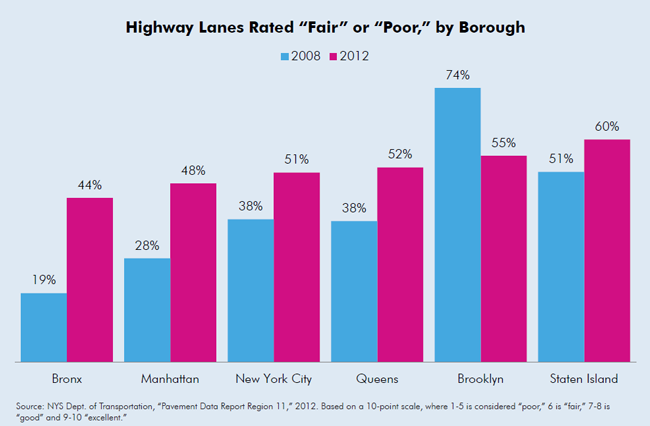
Road Conditions by Borough
Borough % of Street Lanes in "Poor" or "Fair" Condition
Manhattan 42.7%
Staten Island 40.1%
Bronx 34.0%
Queens 29.7%
Brooklyn 27.2%


Worst Street Conditions in NYC, By Community Board
Community Board % of Street Lanes in "Poor" or "Fair" Condition
Manhattan 9 65.9%
Manhattan 11 53.0%
Manhattan 1 48.8%
Manhattan 3 46.4%
Manhattan 8 43.4%
Staten Island 2 43.4%
Brooklyn 13 43.2%
Bronx 10 42.6%
Manhattan 6 42.0%
Queens 2 40.7%


NYC Highways With the Lowest Surface Rating
Route Borough Mileage Surface Rating
Route 25A Queens 12.42 6.0
Korean War Veterans Parkway Staten Island 4.63 6.0
Moshulu Parkway Bronx 3.11 6.0
Pelham Parkway Bronx 2.28 6.0
Route 24 Queens 1.92 6.0
Shore Front Parkway Queens 1.58 6.0
Cross Bay Parkway Queens 0.33 6.0
Jackie Robinson Parkway Queens 4.9 5.8
Route 22 Bronx 0.36 5.0


New York’s “Structural Deficient” Bridges, 2012
  Average Year Built Average Condition Rating # Structurally Deficient % Structurally Deficient
Bronx 1942 4.8 52 16%
Brooklyn 1947 5.1 33 14%
Manhattan 1942 4.7 31 13%
Queens 1960 5.1 43 9%
Staten Island 1963 5.2 3 2%
Total 1951 5.0 162 11%


Bridge Condition, by Owner
Owner Average Year Built # Structurally Deficient % Structurally Deficient
NYCDOT 1934 85 14.2%
NYSDOT 1965 64 10.5%
MTA 1952 11 10.1%
PA 1965 2 1.8%


NYC’s Most Congested Subway Station Entryways, Riders per Entrance
Station Borough Line Ridership Entrances Riders per Entrance
Parkchester Bronx 6 4,687,402 1 4,687,402
Canarsie-Rockaway Pkwy Brooklyn L 3,920,243 1 3,920,243
8 Av Brooklyn N 3,559,576 1 3,559,576
72 St Manhattan 1-2-3 13,043,031 4 3,260,758
Newkirk Plaza Brooklyn B-Q 3,021,079 1 3,021,079
System     1,654,582,265 1,861 889,082


Age and Condition of JFK Cargo Facilities
Status # of Buildings Average Year Constructed Square Feet
Total 33 1973 6,128,879
Viable 13 1994 2,258,433
Nonviable 20 1961 3,870,446


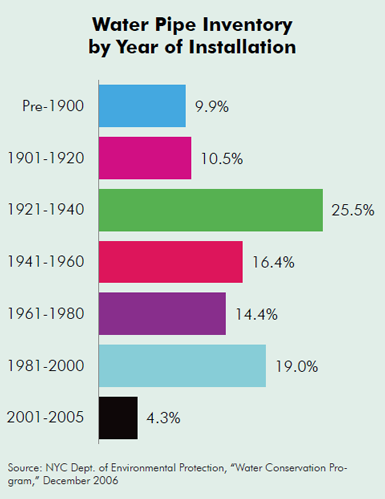
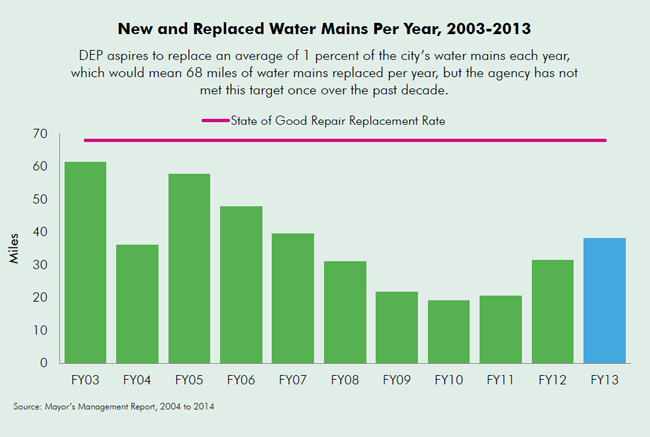
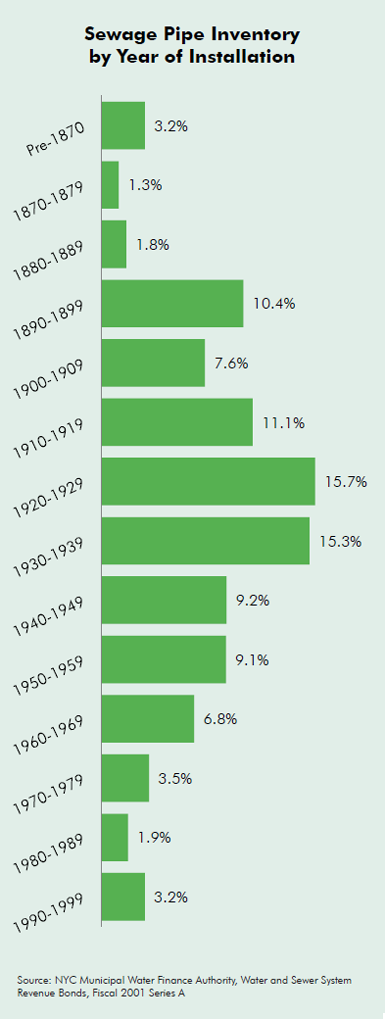
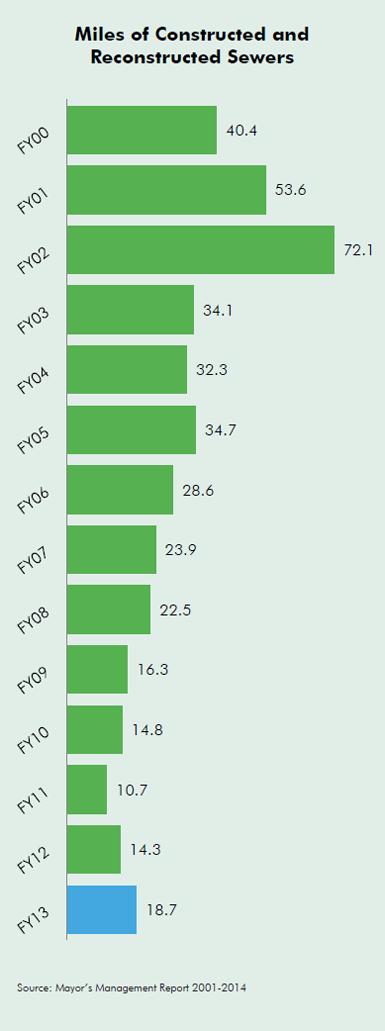
Average Age of NYC’s Utilities Infrastructure
  Miles Age
Gas Mains 6,362 56
Sewage Mains 6,437 84
Water Mains 6,785 69
Overhead Electric Cable 18,245 -
Underground Electric Cable 86,977 -
Steam Pipes 105 60


NYC Electrical System: Service by Overhead Wires vs Underground Cables
  Overhead Wire Underground Cable
Bronx 2,679 10,901
Brooklyn 3,552 27,317
Manhattan - 21,216
Queens 6,995 24,795
Staten Island 5,019 2,748
Total 18,245 86,977


Leaky Pipes: Percent of Water Unaccounted for by Borough, 2011
  Distribution(Million Gallons per Day) Consumption (Million Gallons per Day) % Unaccounted For
Manhattan 334 258 23%
Bronx 203 138 32%
Brooklyn 298 205 31%
Queens 197 171 13%
Staten Island 46 42 9%
NYC 1,078 814 24%


Location of Active Sewage Overflows into New York Harbor, By Severity (Type 1 = Most Severe)
Type of Outfall Staten Island Brooklyn Queens Manhattan Bronx Total
Tier 1 0 3 6 0 4 13
Tier 2 0 6 6 0 3 15
Tier 3 2 7 9 15 10 43


Aging Public Buildings and Spaces
  Number of Buildings Average Year Built
HHC Hospital Buildings 103 1957
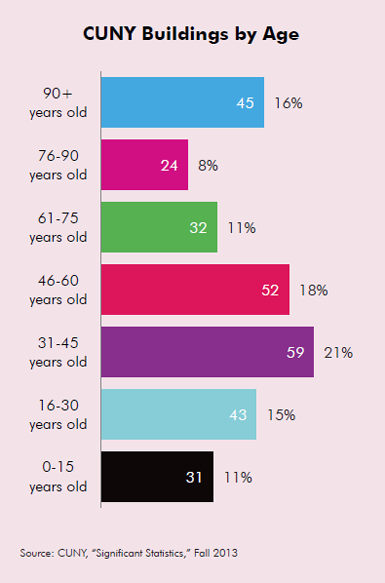
CUNY Buildings 295 1961
DOE School Buildings 1,179 1948
NYPD Precinct Houses 49 1952
City-Owned Court Buildings 23 1943
DHS Homeless Shelters 55 1943
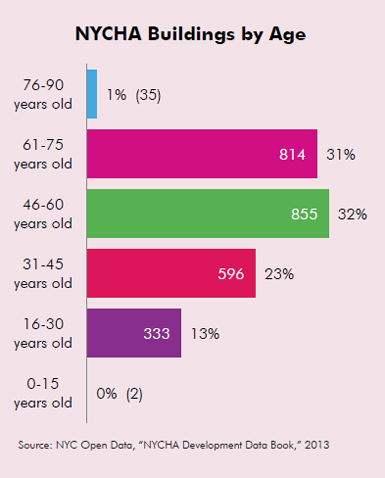
NYCHA Developments 2,596 1963


Repairing Aging Schools: Capital Needs vs Funding Committed, by Borough
Borough Average Year Built Capital Needs FY2014-17 Dollars Committed % Committed
Bronx 1953 $253,638,400 $39,648,464 16%
Brooklyn 1942 $466,260,300 $71,403,022 15%
Manhattan 1947 $234,655,800 $52,106,135 22%
Queens 1951 $258,427,400 $43,563,789 17%
Staten Island 1949 $75,681,400 $13,497,652 18%
Grand Total 1948 $1,290,484,600 $220,219,062 17%


NYCHA Capital Needs, By System (2011-2016)
Category Building System
Apartment $7,589,395,862
Architectural $6,702,844,647
Electrical $217,035,495
Mechanical $1,171,173,158
Building Grounds $892,498,929
Total $16,572,948,091


10 NYCHA Developments in the Worst Condition
Development Borough Score
Butler Bronx 39
Red Hook I (East) Brooklyn 42
Morrisania Bronx 44
Lower East Side II Manhattan 46
Murphy Bronx 46
Albany I & II Brooklyn 47
Van Dyke I Brooklyn 48
Castle Hill Bronx 49
FHA Repossesed Houses V Queens 50
Andrew Jackson Bronx 51


NYCHA Developments with Greatest Façade Needs (2011-2016)
Development Borough Capital Needs
Pomonok Queens $124,375,134
Ravenswood Queens $108,482,664
Breukelen Brooklyn $96,795,137
Williamsburg Brooklyn $93,880,399
Queensbridge South Queens $89,341,132
Marcy Brooklyn $88,494,261
Edenwald Bronx $80,770,819
Queensbridge North Queens $73,497,817
Castle Hill Bronx $72,118,946
Sotomayor Bronx $70,885,992
Patterson Bronx $70,002,441


CUNY Deferred Capital Maintenance by Institution (millions of dollars)
Institutions 2007 Backlog 2012 Backlog Difference
Baruch College 58.0 36.0 (22.0)
Brooklyn College 136.1 245.9 109.8
City College of New York 337.5 438.4 100.9
CUNY School of Law 11.1 9.1 (2.0)
The Graduate Center 0.0 0.0 0.0
Hunter College 220.8 271.7 50.9
John Jay College of Criminal Justice 51.0 85.2 34.2
Lehman College 34.8 31.7 (3.1)
William E. Macaulay Honors College 2.1 4.0 1.9
Medgar Evers College 50.2 78.9 28.7
NYC College of Technology 134.5 105.9 (28.6)
Queens College 147.1 243.3 96.2
College of Staten Island 49.5 61.9 12.4
York College 38.5 135.0 96.5
Senior College Subtotal 1271.2 1747.0 475.8
Borough of Manhattan Community College 65.2 85.2 20.0
Bronx Community College 100.6 175.4 74.8
Hostos Community College 29.4 23.9 (5.5)
Kingsborough Community College 29.6 43.6 14.0
LaGuardia Community College 154.8 233.5 78.7
Queensborough Community College 85.9 169.2 83.3
Community College Subtotal 465.5 730.8 265.3
Grand Total 1736.7 2477.8 741.1


Parks Department Seawalls
Borough Capital Needs FY2014-17 Total Committed % Committed
Bronx $7,341,900 $1,908,181 26%
Brooklyn $6,753,000  $0 0%
Manhattan $15,893,700 $6,409,931 40%
Queens $7,432,100 $272,852 4%
Staten Island $6,295,700 $134,964 2%
NYC $43,716,400 $8,725,928 20%


City Shelters in Need of Repair
  Buildings Average Year Built Capital Needs FY2014-17 External Architecture Sum of Dollars Committed Percent Funded
Bronx 12 1957 $5,889,000 $2,319,600 $3,486,593 59%
Brooklyn 21 1937 $12,738,300 $4,440,900 $326,491 3%
Manhattan 16 1933 $30,650,300 $16,223,000 $3,714,429 12%
Queens 5 1962 $953,800 $449,900 $210,967 22%
Staten Island 1 1937 $48,700 $0 $0 0%
NYC 55 1943 $50,280,100 $23,433,400 $7,738,480 15%


City Courthouses with the Largest Funding Gaps
Court Built Capital Needs FY2014-17 Dollars Committed Funding Gap
Manhattan Criminal Courts Building 1938 $10,043,900 $477,908 $9,565,992
Bronx County Courthouse 1933 $5,541,000 $1,148,788 $4,392,212
Bronx Hall of Justice 2003 $3,173,800 $0 $3,173,800
Manhattan Supreme Court 1925 $3,234,500 $573,424 $2,661,076
Queens Criminal Courts 1961 $3,074,200 $866,501 $2,207,699
Queens Civil/Housing Court 1997 $2,097,100 $0 $2,097,100


City Courthouses in Need of Repair
Borough Average Year Built Courts Surveyed Capital Needs FY2014-17 Dollars Committed Funding Gap
Bronx 1978 4 $19,757,400 $11,714,108 $8,043,292
Brooklyn 1941 3 $7,647,800 $5,142,016 $2,505,784
Manhattan 1926 7 $20,886,700 $5,217,697 $15,669,003
Queens 1955 5 $8,178,600 $2,429,025 $5,749,575
Staten Island 1927 4 $1,186,900 $112,733 $1,074,167
Grand Total 1943 23 $57,657,400 $24,615,579 $33,041,821


Rikers Island Jails with over $10 million in Repair Needs
Rikers Facility State of Good Repair Needs Dollars Committed 2014-2018 Percent Funded
Anna M. Kross Center $22,951,400 $216,891 1%
Eric M. Taylor Center $57,495,300 $3,589,889 6%
George Motchan Detention Center $10,708,000 $376,556 4%
James A. Thomas Center $34,544,000 $0 0%
Otis Bantum Correction Center $14,188,900 $11,087,382 78%
Robert N. Davoren Center $60,292,100 $9,832,843 16%
Rose M. Singer Center $12,312,300 $5,201,548 42%
West Facility $12,600,700 $3,504,700 28%


Estimated Capital Needs and Funding Gap at 18 City Agencies
Agency Capital Needs FY2014-17 Dollars Committed Funding Gap
Department of Education $1,316,169,000 $224,484,914 $1,091,684,086
Department of Transportation $3,192,417,000 $2,402,590,000 $789,827,000
Dept. of Parks and Recreation $471,151,000 $81,225,000 $389,926,000
Department of Correction $292,502,000 $45,151,000 $247,351,000
Dept. of Small Business Services $229,592,000 $13,623,000 $215,969,000
Health and Hospitals Corporation $282,014,000 $97,329,000 $184,685,000
Department of Sanitation $109,867,000 $20,296,000 $89,571,000
Dept. of Citywide Admin. Services $129,929,000 $40,550,000 $89,379,000
Department of Cultural Affairs $85,267,000 $25,212,000 $60,055,000
Department of Homeless Services $50,280,000 $7,738,000 $42,542,000
Police Department $59,708,000 $24,500,000 $35,208,000
Fire Department $18,585,000 $3,337,000 $15,248,000
Dept. of Health & Mental Hygiene $17,138,000 $2,771,000 $14,367,000
Human Resources Administration $9,145,000 $1,436,000 $7,709,000
Department for the Aging $1,528,000 $292,000 $1,236,000
Division of Youth & Family Justice $1,117,000 - $1,117,000
Admin. for Children's Services $1,053,000 - $1,053,000
Taxi & Limousine Commission $1,289,000 $1,289,000 -
Total $6,268,751,000 $2,991,823,914 $3,276,927,086


MTA “Megaproject” Cost and Completion Schedules
  Original Project Current Projection
Project Estimated Cost (in millions) Completion Schedule Estimated Cost (in millions) Completion Schedule
South Ferry Terminal $420 April 2009 $541 February 2011
Fulton Street Transit Center $750 July 2009 $1,400 June 2014
Flushing Line Extension $1,900 June 2013 $2,153 June 2014
Second Avenue Subway $3,800 June 2014 $4,500 December 2016
East Side Access $6,300 August 2014 $10,000 2021