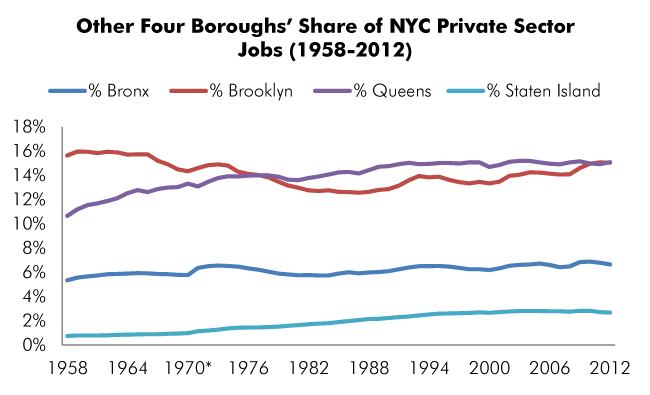
Manhattan remains the epicenter of New York City’s economy, but the other four boroughs now comprise roughly 40 percent of all private sector jobs in the city, their highest total ever. In 2012, Manhattan accounted for 60.50 percent of the city’s private sector jobs, down from 65.92 percent in 1982 and 63.08 percent as recently as 2000.
Of all the boroughs, Brooklyn has experienced the biggest increase in its share of the city’s employment base since 2000. In 2012, Brooklyn accounted for 15.06 percent of all private sector jobs in the city, up from 13.35 percent in 2000. The Bronx also registered a notable jump, with its share rising from 6.19 percent in 2000 to 6.66 percent in 2012. Queens had a smaller increase (from 14.71 percent to 15.10 percent) while Staten Island’s portion was essentially unchanged (from 2.67 percent to 2.68 percent).
Between the economic boom from 2002 and 2008, Manhattan’s share of city jobs remained relatively steady – comprising between 61.07 percent and 61.59 percent of the citywide total. But between 2008 and 2009, the borough’s share dropped by more than a percentage point, going from 61.59 in 2008 to 60.53 in 2009. Manhattan’s share reached an historic low of 60.31 in 2010, and is up slightly since then.
According to the report, the shift reflects that fact that the four outer boroughs are all adding jobs at a much faster clip than Manhattan. Between 2000 and 2012, Manhattan had a net gain of 18,994 private sector jobs, a 1.0 percent increase. That was just a fraction of the 161,832 jobs created citywide during this time. In fact, every borough but Staten Island added more jobs than Manhattan during this period: Brooklyn had a net gain of 76,536 jobs (an 18.8 percent spike), followed by Queens (+36,402 jobs – an 8.1 percent jump), the Bronx (+25,166 jobs, a 13.3 percent increase) and Staten Island (4,734 – a 5.8 percent increase).
This is not just a recent trend. Between 1982 and 2012, Manhattan experienced a net gain of 113,616 private sector jobs, a 6.6 percent increase. Every other borough had a larger percentage increase during this 30 year period. Staten Island was up by 79.2 percent (a net gain of 38,166 jobs), Brooklyn by 36.5 percent (+ 129,493 jobs), the Bronx by 32.9 percent (+53,094) and Queens by 26.8 percent (+102,620).
|
Each Borough’s Share of NYC Private Sector Jobs by Decade (1962 - 2012) |
|---|
|
Year |
% Bronx |
% Brooklyn |
% Manhattan |
% Queens |
% Staten Island |
|
1962 |
5.86% |
15.96% |
65.48% |
11.89% |
0.81% |
|
1972* |
6.51% |
14.85% |
63.96% |
13.46% |
1.21% |
|
1982 |
5.79% |
12.77% |
65.92% |
13.79% |
1.73% |
|
1992 |
6.40% |
13.62% |
62.58% |
15.04% |
2.36% |
|
2002 |
6.55% |
13.96% |
61.59% |
15.13% |
2.78% |
|
2012 |
6.66% |
15.06% |
60.50% |
15.10% |
2.68% |

|
Each Borough’s Share of NYC Private Sector Jobs (1958 - 2012) |
|---|
|
Year |
% Bronx |
% Brooklyn |
% Manhattan |
% Queens |
% Staten Island |
|
1958 |
5.36% |
15.65% |
67.59% |
10.66% |
0.75% |
|
1959 |
5.57% |
15.97% |
66.47% |
11.20% |
0.79% |
|
1960 |
5.68% |
15.96% |
66.01% |
11.56% |
0.79% |
|
1961 |
5.75% |
15.85% |
65.91% |
11.69% |
0.79% |
|
1962 |
5.86% |
15.96% |
65.48% |
11.89% |
0.81% |
|
1963 |
5.87% |
15.90% |
65.27% |
12.12% |
0.85% |
|
1964 |
5.90% |
15.72% |
65.00% |
12.53% |
0.86% |
|
1965 |
5.95% |
15.73% |
64.65% |
12.79% |
0.88% |
|
1966 |
5.93% |
15.73% |
64.82% |
12.62% |
0.90% |
|
1967 |
5.87% |
15.22% |
65.14% |
12.87% |
0.90% |
|
1968 |
5.86% |
14.91% |
65.30% |
13.00% |
0.93% |
|
1969 |
5.80% |
14.51% |
65.69% |
13.04% |
0.96% |
|
1970* |
5.79% |
14.35% |
65.53% |
13.33% |
0.99% |
|
1971* |
6.37% |
14.62% |
64.76% |
13.10% |
1.15% |
|
1972* |
6.51% |
14.85% |
63.96% |
13.46% |
1.21% |
|
1973 |
6.56% |
14.92% |
63.44% |
13.79% |
1.28% |
|
1974 |
6.53% |
14.81% |
63.35% |
13.93% |
1.38% |
|
1975 |
6.47% |
14.30% |
63.86% |
13.92% |
1.44% |
|
1976 |
6.33% |
14.13% |
64.11% |
13.98% |
1.45% |
|
1977 |
6.22% |
14.04% |
64.28% |
14.00% |
1.46% |
|
1978 |
6.06% |
13.85% |
64.61% |
14.00% |
1.49% |
|
1979 |
5.91% |
13.49% |
65.18% |
13.89% |
1.52% |
|
1980 |
5.83% |
13.17% |
65.77% |
13.64% |
1.60% |
|
1981 |
5.77% |
12.98% |
65.98% |
13.62% |
1.65% |
|
1982 |
5.79% |
12.77% |
65.92% |
13.79% |
1.73% |
|
1983 |
5.75% |
12.71% |
65.84% |
13.92% |
1.78% |
|
1984 |
5.74% |
12.77% |
65.60% |
14.07% |
1.82% |
|
1985 |
5.90% |
12.65% |
65.28% |
14.26% |
1.90% |
|
1986 |
6.01% |
12.62% |
65.09% |
14.29% |
1.99% |
|
1987 |
5.93% |
12.57% |
65.26% |
14.17% |
2.07% |
|
1988 |
6.00% |
12.65% |
64.76% |
14.43% |
2.15% |
|
1989 |
6.03% |
12.80% |
64.28% |
14.72% |
2.17% |
|
1990 |
6.11% |
12.88% |
63.99% |
14.78% |
2.24% |
|
1991 |
6.27% |
13.16% |
63.31% |
14.93% |
2.32% |
|
1992 |
6.40% |
13.62% |
62.58% |
15.04% |
2.36% |
|
1993 |
6.51% |
13.95% |
62.14% |
14.93% |
2.46% |
|
1994 |
6.52% |
13.84% |
62.16% |
14.95% |
2.52% |
|
1995 |
6.54% |
13.90% |
61.93% |
15.02% |
2.60% |
|
1996 |
6.48% |
13.63% |
62.26% |
15.03% |
2.61% |
|
1997 |
6.38% |
13.45% |
62.56% |
14.99% |
2.63% |
|
1998 |
6.26% |
13.34% |
62.67% |
15.08% |
2.65% |
|
1999 |
6.26% |
13.47% |
62.49% |
15.07% |
2.70% |
|
2000 |
6.19% |
13.35% |
63.08% |
14.71% |
2.67% |
|
2001 |
6.33% |
13.49% |
62.59% |
14.87% |
2.72% |
|
2002 |
6.55% |
13.96% |
61.59% |
15.13% |
2.78% |
|
2003 |
6.62% |
14.05% |
61.31% |
15.20% |
2.81% |
|
2004 |
6.65% |
14.25% |
61.07% |
15.20% |
2.82% |
|
2005 |
6.73% |
14.24% |
61.13% |
15.08% |
2.81% |
|
2006 |
6.62% |
14.15% |
61.47% |
14.97% |
2.80% |
|
2007 |
6.43% |
14.08% |
61.78% |
14.92% |
2.79% |
|
2008 |
6.50% |
14.09% |
61.59% |
15.07% |
2.76% |
|
2009 |
6.85% |
14.62% |
60.53% |
15.16% |
2.83% |
|
2010 |
6.89% |
14.98% |
60.31% |
14.99% |
2.83% |
|
2011 |
6.79% |
15.08% |
60.47% |
14.93% |
2.72% |
|
2012 |
6.66% |
15.06% |
60.50% |
15.10% |
2.68% |
|
Each Borough’s Private Sector Job Totals (1958 - 2008) |
|---|
|
Year |
NYC |
Bronx |
Brooklyn |
Manhattan |
Queens |
Staten Island |
|
1958 |
2,814,041 |
150,744 |
440,323 |
1,901,919 |
299,903 |
21,152 |
|
1959 |
2,846,067 |
158,418 |
454,473 |
1,891,852 |
318,739 |
22,585 |
|
1960 |
2,888,627 |
164,096 |
460,897 |
1,906,901 |
333,792 |
22,941 |
|
1961 |
2,871,734 |
165,147 |
455,302 |
1,892,828 |
335,729 |
22,728 |
|
1962 |
2,887,468 |
169,147 |
460,830 |
1,890,848 |
343,264 |
23,379 |
|
1963 |
2,844,277 |
166,835 |
452,138 |
1,856,384 |
344,838 |
24,082 |
|
1964 |
2,855,877 |
168,406 |
448,837 |
1,856,237 |
357,824 |
24,573 |
|
1965 |
2,850,661 |
169,749 |
448,427 |
1,842,900 |
364,535 |
25,050 |
|
1966 |
2,886,953 |
171,162 |
454,020 |
1,871,269 |
364,380 |
26,122 |
|
1967 |
2,903,002 |
170,496 |
441,715 |
1,891,063 |
373,599 |
26,129 |
|
1968 |
2,932,650 |
171,731 |
437,339 |
1,914,883 |
381,361 |
27,336 |
|
1969 |
2,977,850 |
172,707 |
432,059 |
1,956,061 |
388,448 |
28,575 |
|
1970* |
2,894,797 |
167,540 |
415,531 |
1,897,047 |
385,883 |
28,796 |
|
1971* |
2,943,365 |
187,538 |
430,404 |
1,906,074 |
385,591 |
33,758 |
|
1972* |
2,937,281 |
191,289 |
436,307 |
1,878,785 |
395,381 |
35,519 |
|
1973 |
2,905,866 |
190,594 |
433,553 |
1,843,532 |
400,864 |
37,323 |
|
1974 |
2,814,344 |
183,800 |
416,864 |
1,782,972 |
391,999 |
38,709 |
|
1975 |
2,665,690 |
172,505 |
381,254 |
1,702,341 |
371,160 |
38,430 |
|
1976 |
2,640,592 |
167,184 |
373,221 |
1,692,865 |
369,042 |
38,280 |
|
1977 |
2,631,795 |
163,620 |
369,383 |
1,691,799 |
368,495 |
38,498 |
|
1978 |
2,674,931 |
162,060 |
370,434 |
1,728,240 |
374,451 |
39,746 |
|
1979 |
2,717,742 |
160,696 |
366,532 |
1,771,534 |
377,551 |
41,429 |
|
1980 |
2,745,176 |
159,954 |
361,425 |
1,805,369 |
374,471 |
43,957 |
|
1981 |
2,802,831 |
161,845 |
363,777 |
1,849,225 |
381,701 |
46,282 |
|
1982 |
2,781,704 |
161,155 |
355,146 |
1,833,703 |
383,539 |
48,159 |
|
1983 |
2,793,220 |
160,668 |
354,984 |
1,839,123 |
388,687 |
49,758 |
|
1984 |
2,856,889 |
163,894 |
364,896 |
1,874,190 |
401,887 |
52,022 |
|
1985 |
2,885,997 |
170,413 |
365,183 |
1,883,982 |
411,658 |
54,761 |
|
1986 |
2,919,156 |
175,541 |
368,385 |
1,899,964 |
417,268 |
57,998 |
|
1987 |
2,956,819 |
175,216 |
371,595 |
1,929,554 |
419,103 |
61,351 |
|
1988 |
2,953,132 |
177,309 |
373,649 |
1,912,341 |
426,269 |
63,563 |
|
1989 |
2,950,712 |
178,004 |
377,606 |
1,896,753 |
434,361 |
63,988 |
|
1990 |
2,902,948 |
177,462 |
373,830 |
1,857,702 |
428,987 |
64,968 |
|
1991 |
2,738,940 |
171,742 |
360,486 |
1,734,141 |
409,033 |
63,538 |
|
1992 |
2,658,222 |
170,208 |
361,968 |
1,663,512 |
399,797 |
62,736 |
|
1993 |
2,659,884 |
173,236 |
371,123 |
1,652,975 |
397,244 |
65,307 |
|
1994 |
2,695,629 |
175,673 |
373,105 |
1,675,735 |
403,111 |
68,005 |
|
1995 |
2,721,707 |
178,080 |
378,410 |
1,685,655 |
408,762 |
70,801 |
|
1996 |
2,768,844 |
179,454 |
377,410 |
1,723,754 |
416,080 |
72,147 |
|
1997 |
2,826,928 |
180,308 |
380,239 |
1,768,491 |
423,658 |
74,232 |
|
1998 |
2,897,776 |
181,395 |
386,449 |
1,816,101 |
437,086 |
76,745 |
|
1999 |
2,965,496 |
185,772 |
399,448 |
1,853,041 |
447,048 |
80,187 |
|
2000 |
3,056,859 |
189,083 |
408,103 |
1,928,325 |
449,757 |
81,591 |
|
2001 |
3,015,780 |
190,814 |
406,909 |
1,887,580 |
448,596 |
81,881 |
|
2002 |
2,907,686 |
190,334 |
405,868 |
1,790,723 |
439,855 |
80,905 |
|
2003 |
2,878,033 |
190,598 |
404,478 |
1,764,430 |
437,512 |
81,016 |
|
2004 |
2,896,368 |
192,639 |
412,817 |
1,768,849 |
440,341 |
81,722 |
|
2005 |
2,947,476 |
198,432 |
419,773 |
1,801,933 |
444,376 |
82,962 |
|
2006 |
3,009,902 |
199,274 |
425,946 |
1,850,047 |
450,503 |
84,132 |
|
2007 |
3,093,315 |
198,945 |
435,412 |
1,911,098 |
461,657 |
86,203 |
|
2008 |
3,123,467 |
202,880 |
440,022 |
1,923,787 |
470,641 |
86,138 |
|
2009 |
3,015,878 |
206,604 |
440,868 |
1,825,655 |
457,281 |
85,470 |
|
2010 |
3,042,794 |
209,540 |
455,702 |
1,835,231 |
456,065 |
86,256 |
|
2011 |
3,130,366 |
212,645 |
472,203 |
1,892,862 |
467,481 |
85,175 |
|
2012 |
3,218,691 |
214,249 |
484,639 |
1,947,319 |
486,159 |
86,325 |
Source: NYS Department of Labor, Insured Employment, 1958-2012.
*Note: Coverage changes for Non-profits added large numbers of workers to the insured employment data between 1970 and 1972.