Over the past five years, New York City’s senior population has reached three important milestones. The number of older New Yorkers has crossed the one million mark for the first time in the city’s history. There are now more people over the age of 65 in the city than there are children ages 10 and younger. And for the first time since the end of World War II, the share of older New Yorkers who were born outside of the U.S. reached 49.5 percent—nearly equal to the native-born share.
Although the graying of the population is happening across the country, New York City is unique in that the growth in the senior population is being driven almost entirely by the increase in immigration since 1965. Between 1980 and 2015, New York’s City’s foreign-born population grew by 1.6 million, or 95 percent. But while a whopping 95 percent of the city’s older immigrants came from Europe in 1950, today’s seniors are vastly more diverse. Now only 26 percent of older immigrants are from Europe, while 46 percent are from Latin America and the Caribbean and 23 percent are from Asia and Oceania.
The growth in New York’s older immigrant population is far outpacing that of the U.S. born senior population. Although the number of native-born seniors grew just 6 percent from 2010 to 2015, the number of immigrant seniors jumped 21 percent. While this demographic shift is being felt across all five boroughs, Brooklyn experienced the most dramatic change over the past five years. In that borough the population of immigrant seniors increased 30 percent while the native-born senior population decreased 4 percent.
The rich diversity of New York’s senior population reflects the city’s long history as a beacon to immigrants from around the world. But this diversity has significant implications for the way senior services are delivered. As a group, immigrant seniors are 1.5 times as likely as native-born seniors to be poor, and almost two out of three speak English less than very well. Immigrant seniors and their families are less likely than native-born seniors to receive critical social support services, and the nonprofit organizations that serve immigrant seniors tend to be smaller and less well-funded than those that serve the general senior population.
Our major findings include the following:
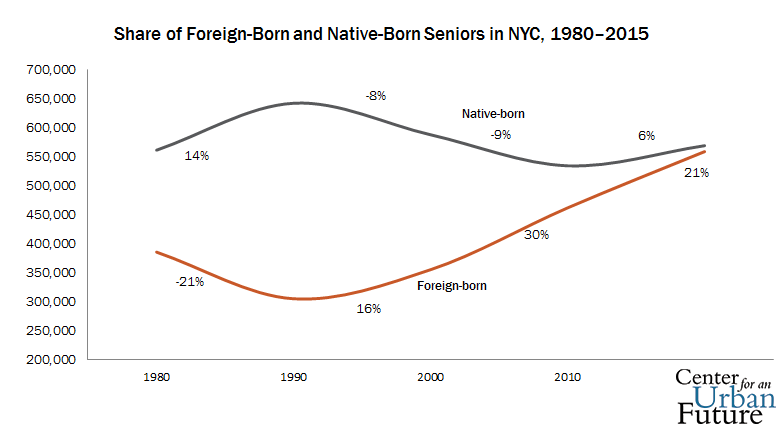
- As of 2015, 49.5 percent of New Yorkers ages 65 or older are foreign-born, up from 46 percent in 2010 and 38 percent in 2000.
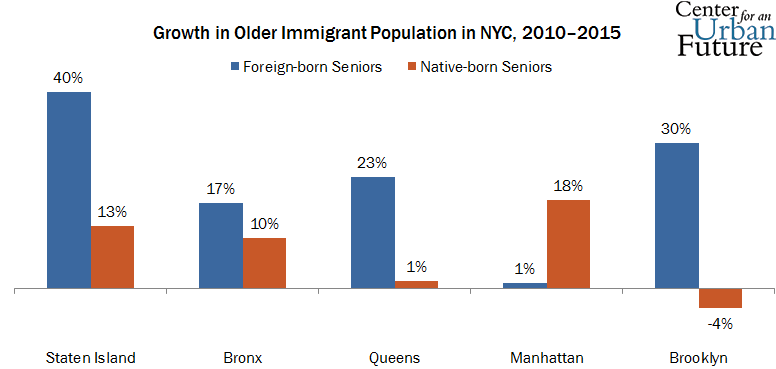
- The growth in the older immigrant population outpaced that of the native-born senior population in every borough except Manhattan.
- The largest increase was on Staten Island, where the population of immigrant seniors has grown 40 percent since 2010.
- By 2020, the majority of New York City’s seniors will be immigrants.
- There are now 23 out of the 55 Census-defined neighborhoods citywide where the majority of seniors are immigrants, up from 21 in 2010.
- The older immigrant population in the Sunnyside/Woodside neighborhood in Queens increased 80 percent—the largest overall increase in the city.
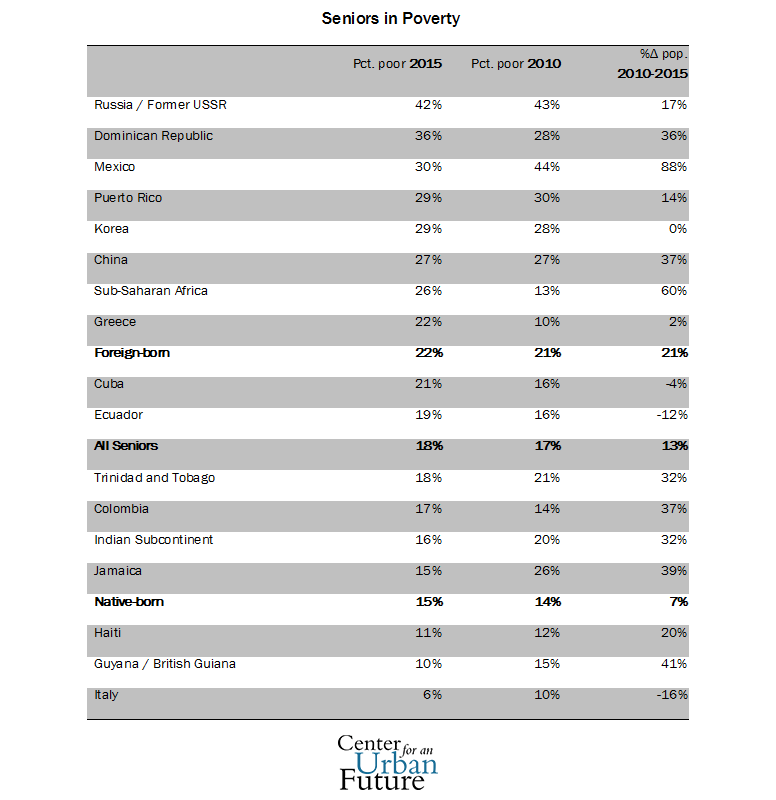
- Immigrant seniors are 50 percent more likely to be living in poverty than native-born seniors and poverty rates among older adults are increasing.
- Seniors from Russia and the former Soviet bloc experience a poverty rate of 42 percent—the highest of any group.
- The number of older adults from Mexico nearly doubled—the largest increase of any major population.
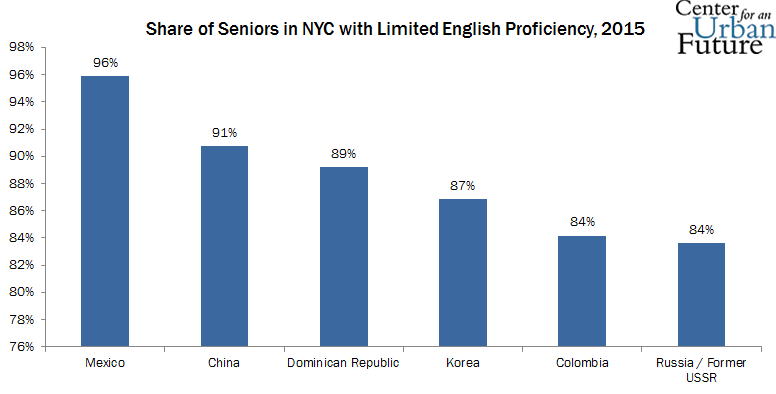
- Most older immigrants are not proficient in English, but proficiency rates increased slightly.
In the face of an increasing—and increasingly diverse—senior population, and facing aggressive cuts to senior services from Washington, the city may lack the resources required to meet the challenge. To its credit, the de Blasio administration has steadily increased funding for the city’s Department for the Aging (DFTA), which provides the main source of funds for senior services in the city. DFTA’s budget for fiscal year 2017 stands at $330 million, an increase of 25 percent since the current mayor took office. However, these recent increases merely bring DFTA’s budget back to 2008 levels. Overall, the agency’s budget is up just 5 percent since 2008, while the senior population increased 9 percent during that time. But serving a diverse and growing older population will require more resources and greater attention to the needs of the city’s cultural and linguistic communities.
This data brief updates the data we presented in our July 2013 report, The New Face of New York's Seniors, drawing on Census data to provide extensive demographic details about New York’s older immigrant population, including countries of origin, how long they have resided in the United States, which neighborhoods they live in, and how many have access to government assistance, among other findings. This brief is the latest in a series of Center for an Urban Future reports exploring New York’s growing immigrant population and the unique barriers to economic opportunity facing foreign-born residents.
Immigrants are driving the growth of New York City’s aging population
The number of city residents 65 and older is expected to grow by 35 percent over the next two decades, increasing from 12 to 15 percent of the city’s population. But within this larger demographic trend is an important but little noticed development: immigrants now make up nearly half of the city’s senior population and are driving nearly all of its growth.
Between 2000 and 2010 the foreign born senior population grew by 30 percent while the native born senior population declined by 9 percent. Since then, New York City has experienced a 21 percent increase in the foreign-born senior population and the native-born senior population has increase 6 percent. With 559,681 foreign born residents over the age of 65 (up from 462,779 in 2010), New York has by far the largest immigrant senior population of any U.S. city. If current trends continue, immigrants will comprise the majority of the city’s older adult population by 2020.
 Immigrants now comprise 49.5 percent of the city's senior population, and the growth in the older immigrant population outpaced that of the native-born senior population in every borough except Manhattan. The biggest gap was in Brooklyn, where the older immigrant population increased 30 percent while the native-born population decreased 4 percent. In Manhattan the native-born senior population increased 18 percent, while the older immigrant population increased just 1 percent.
Since 2010, the senior populations of two more neighborhoods have become immigrant-majority: Williamsbridge/Baychester in the Bronx, which is in community district (CD) 12, and Sheepshead Bay / Gravesend in Brooklyn (CD 15). There are now 23 neighborhoods citywide—as defined by the U.S. Census’ Public Use Microdata Areas (PUMA)—where the number of immigrant seniors exceeds that of native-born seniors, including ten out of the 14 neighborhoods in Queens. In fact, immigrants are responsible for all of the growth in the senior population in 13 out of the city’s 55 Census-designated neighborhoods.
Since 2010, the senior populations of two more neighborhoods have become immigrant-majority: Williamsbridge/Baychester in the Bronx, which is in community district (CD) 12, and Sheepshead Bay / Gravesend in Brooklyn (CD 15). There are now 23 neighborhoods citywide—as defined by the U.S. Census’ Public Use Microdata Areas (PUMA)—where the number of immigrant seniors exceeds that of native-born seniors, including ten out of the 14 neighborhoods in Queens. In fact, immigrants are responsible for all of the growth in the senior population in 15 out of the city’s 55 Census-designated neighborhoods.
Sunnyside/Woodside in Queens, roughly encompassing CD 2, had the greatest increase in the overall senior population among New York City’s neighborhoods. The neighborhood’s overall senior population increased by 55 percent, while the older immigrant population increased by 80 percent. Meanwhile, the native-born senior population senior population in the neighborhood increased by 8 percent. University Heights / Fordham in the Bronx (CD 5) experienced the second largest increase in the senior population (55 percent), and also a 60 percent increase in the older immigrant population and a 37 percent increase in the native-born senior population. However, more than half (55 percent) of the growth in the native-born senior population is due to the increase in Puerto Rican seniors.
In Staten Island, the South Shore (CD 3) had the greatest increase in the senior population, registering a 36 percent increase in the overall senior population, a 23 percent increase in the older immigrant population, and a 36 percent increase in the native-born senior population. East Flatbush in Brooklyn (CD 17) had the greatest increase in that borough, with a 35 percent increase in the overall senior population, an 85 percent increase in the older immigrant population, and a 34 percent decrease in the native-born senior population.
Seniors from China are responsible for the greatest increase in the senior population from any country or region of origin citywide, particularly in Sunnyside (CD 2) and Flushing, Queens (CD 7). Immigrants from the Dominican Republic are the dominant group in 16 neighborhoods, and are also driving the growth in the senior population in several neighborhoods, most notably in East Flatbush, Brooklyn (CD 10), and Queens Village (CD 13). Meanwhile, seniors from Russia and other former Soviet republics drive the growth in the senior population in Bay Ridge, Sheepshead Bay, and Coney Island (CDs 10, 12, and 15, respectively).
Most older immigrants came to the United States when they were younger and are now moving into the 65-plus age category. Only 8 percent of foreign-born older adults in New York City came to the U.S. when they were already over age 65. But this differs significantly by country or region of origin. For example, the average age at which a senior immigrant from the Middle East arrived in the U.S. is 28, and the average senior from Italy arrived at age 26, meaning that they have spent most of their working lives in this country. In contrast, the average senior from Russia and the former Soviet Union arrived at age 49, the highest of any country or region of origin group. Not far behind are seniors from China and India, who arrived at age 46 on average.
Foreign-born older adults are more likely to be poor
Older immigrants are significantly poorer on average than native-born seniors, but poverty levels differ significantly by country or region of origin. Between 2010 and 2015 poverty among seniors overall increased one percentage point. Among older immigrants the share living below the federal poverty line increased from 21 to 22 percent and from 14 to 15 percent among native-born seniors. The most significant increase in the poverty rate was among seniors from sub-Saharan African countries, rising from 13 percent in 2010 to 26 percent in 2015. Poverty among seniors from Greece also increased significantly, from 10 to 22 percent. Poverty among seniors from Russia and the other former Soviet republics declined by one percent in the last five years, though at 42 percent, they are the poorest seniors of any country or region of origin group. Bucking this trend are Mexican seniors, who experienced an overall drop in the poverty rate from 44 percent in 2010 to 30 percent in 2015. While this is a significant drop in the poverty rate, Mexican seniors are still the third poorest group in the city.
In most cases, large changes in the population seem to be the cause of these big changes in the poverty rate. The Mexican senior population nearly doubled in the past five years while the number of seniors from sub-Saharan African countries increased 60 percent. The composition of the new entrants into the age group for each country or region of origin may be different from the existing composition. The data give some clues as to what those changes may be. For instance, in 2010 the average age at which a Mexican senior arrived in the U.S. was 46. By 2015 the average age had dropped to 36. The Mexico-born seniors who are entering the 65 and over age bracket seemed to have arrived in the U.S. at an earlier age than their predecessors, and may have had the opportunity to become more financially stable during their working years.
The median income of immigrant seniors citywide is now $10,800, but is still about half of the median income of native-born seniors, which stands at $20,800. Part of the reason for the large gap in income between foreign- and native-born seniors is because 33 percent of older immigrants do not receive Social Security benefits, compared to 17 percent of native-born seniors. These numbers are up from 31 percent and 16 percent in 2010, respectively.
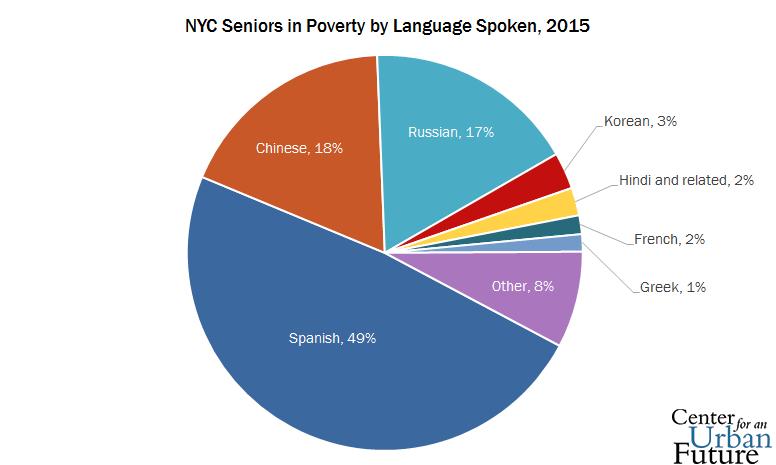
Most older immigrants are not proficient in English
The share of older immigrants who speak English less than very well declined slightly from 60 percent in 2010 to 59 percent in 2015. The share who live in linguistically isolated households, meaning that nobody in their households over the age of 14 speaks English, declined from 37 percent to 36 percent.
Explore the maps below to learn more about the immigrant senior population in each of New York's neighborhoods.
Data Source: CUF analysis of U.S. Census, 2010–2015 American Community Survey data. Tabulated using IPUMS USA.
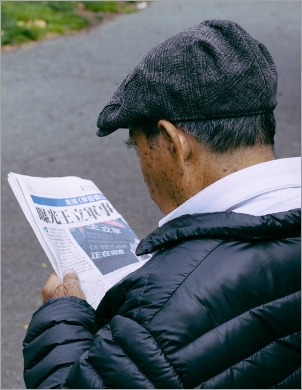
Photo credit: Eepeng Cheong/Unsplash