Libraries Teach Tech: Building Skills for a Digital World
This new data brief finds that NYC’s public libraries are playing an increasingly important role in helping New Yorkers develop the technology skills needed in today’s economy. It shows that the city’s libraries provided tech training to more than 150,000 New Yorkers in 2015, an 81 percent increase from just three years earlier.
If New York City is going to succeed in reducing inequality and put more New Yorkers on the path to the middle class, it will need to significantly increase the number of city residents with digital skills. That’s because so many of the good-paying jobs being created in today’s economy require some level of technology skills. These jobs include the bulk of opportunities in the city’s soaring tech sector, but also a growing share of the positions in more traditional fields, from health care to manufacturing, which are adopting new technologies at a rapid clip. In fact, a recent report by Burning Glass found that 88 percent of middle-skill jobs in New York were digitally intensive.
This data analysis is part of a series of research briefs on New York City public libraries that was generously funded by the Charles H. Revson Foundation.
General operating support for the Center for an Urban Future is provided by the Bernard F. and Alva B. Gimbel Foundation, with additional support from the Lucius N. Littauer Foundation and the M&T Charitable Foundation.
Although many of these technology jobs have the potential to boost New Yorkers into the middle class, alarmingly few residents from the city’s low-income communities are equipped with the tech skills that are in such high demand.
The de Blasio administration is attempting to address this skills gap through its promising Tech Talent Pipeline initiative. In addition, a number of nonprofit and for-profit entities across the city–from Girls Who Code and Access Code to the Flatiron School–are providing scores of New Yorkers from underserved communities with the coding, programming, and web-development skills that so many employers now require.
But some of the most important efforts to boost digital skills are coming from an unlikely source: the city’s public libraries.
As this data brief shows, the city’s three public library systems served more than 158,000 people with technology training programs in 2015. This represents an astounding 81 percent increase from just three years ago, when the libraries served 87,000 people.
Beyond simply serving tens of thousands of New Yorkers, the libraries are reaching many who aren’t being served by other digital training initiatives. One of the libraries’ advantages is that, with 217 branches, the systems have a physical presence in nearly every community throughout the five boroughs.
In 2015, 28 branches across the city served at least 1,000 people with tech training programs: 13 branches in Manhattan, 11 in Brooklyn, 10 in the Bronx, 4 in Queens, and 1 on Staten Island.
The massive Mid-Manhattan Library served the most people with tech training programs in 2015 (14,704 attendees). Surprisingly, the Parkchester branch in the southeast Bronx had the second highest attendance (9,462). It was followed by the Morningside Heights branch in Manhattan (7,454), the Castle Hill branch in the Bronx (5,980), the Countee Cullen branch in Harlem (4,486), the Brooklyn Central Library at Grand Army Plaza (3,908), the Stephen A. Schwarzman building in Midtown (3,835), the Chatham Square branch in Chinatown (3,770), and the Wakefield branch (3,630) in the north Bronx.
Much of the growth in the libraries’ tech training programs is occurring in neighborhoods whose residents are underrepresented in the city’s tech workforce. In fact, 38 of the 50 branches with the greatest growth in tech program attendance between 2012 and 2015 are located outside of Manhattan, with 15 in Brooklyn, 14 in the Bronx, 7 in Queens and 2 on Staten Island.1 And of the twelve Manhattan branches on the list, three are in Harlem, one is in Chinatown, and one is on Roosevelt Island. The following branches posted the largest growth in attendance for tech training programs:
Epiphany Library (Gramercy) +4,259 percent, from 17 attendees in 2012 to 741 in 2015.
Queens Central–Children’s Library (Queens) +2,787 percent, from 23 in 2012 to 664 in 2015.
Queens Central (Queens) +1,616 percent, from 193 to 3,312.
Richmondtown (Staten Island) +1,546 percent, from 39 to 642.
Rochdale Village (Queens) +1,504 percent, from 66 to 1,059.
Columbus Library (Hell’s Kitchen) +1,394 percent, from 140 to 2,091
Parkchester (Bronx) +1157 percent, from 753 to 9,462.
Castle Hill (Bronx) +1096 percent, from 500 to 5,980.
Sheepshead Bay (Brooklyn) +1,070 percent, from 74 to 866.
Laurelton (Queens) +953 percent, from 115 to 1,211.
Saratoga (Bed Stuy) +897 percent, from 70 to 698.
Kings Bay (Brooklyn) +757 percent, from 192 to 1,646.
Wakefield (Bronx) +733 percent, from 436 to 3,630.
New Amsterdam (Lower Manhattan) +687 percent, from 68 to 535.
Countee Cullen Library (Harlem) +633 percent, from 612 to 4,486.
The libraries’ technology programs run the gamut from high-level coding courses to more basic computer classes. While some are more in-demand than others–New York Public Library’s Project Code program currently serves just 400 people and has a wait-list of 5,000–they are all contributing to a more digitally literate workforce.
The importance of these programs is hard to understate. Employment in the city’s tech sector grew by 71 percent from 2004 to 2014 (from 68,571 to 117,147 jobs), far outpacing the overall job growth in the city’s economy.2 Yet, many of the city’s tech companies struggle to attract workers with the technology skills they need. At the same time, although many low-income New Yorkers would jump at the chance to get a decent-paying tech job, too few of these residents have the digital skills that employers require. One consequence is that tech companies do not resemble New York City as a whole: African Americans make up just 9 percent of the city’s tech workforce, while Hispanics account for only 11 percent.3
As city policymakers continue to develop strategies for addressing the tech talent gap and creating pathways to the middle class, libraries should be seen as a crucial part of the equation.
NYC Library Branches Where Attendance in
Tech Training Programs Topped 1,000 in FY 2015
Branch
Attendance in Tech
Training Programs, 2015
Borough
St. George Library Center
1,350
Staten Island
Mid-Manhattan Library
14,704
Manhattan
Morningside Heights
7,454
Manhattan
Countee Cullen Branch
4,486
Manhattan
Stephen A. Schwarzman Building
3,835
Manhattan
Chatham Square Branch
3,770
Manhattan
67th Street Branch
3,013
Manhattan
58th Street Branch
2,323
Manhattan
Columbus Branch
2,091
Manhattan
Seward Park Branch
1,749
Manhattan
Washington Heights Branch
1,675
Manhattan
Yorkville Branch
1,109
Manhattan
Inwood Branch
1,058
Manhattan
Queens Central
3,312
Queens
Laurelton
1,211
Queens
Rochdale Village
1,059
Queens
Flushing
1,028
Queens
Brooklyn Central Library
3,908
Brooklyn
Kings Highway
2,858
Brooklyn
Central Library Learning Center
2,656
Brooklyn
Stone Avenue
1,800
Brooklyn
Kings Bay
1,646
Brooklyn
Cortelyou
1,382
Brooklyn
Washington Irving
1,346
Brooklyn
Clarendon
1,137
Brooklyn
Cypress Hills
1,118
Brooklyn
Eastern Parkway Learning Center
1,065
Brooklyn
Andrew Heiskell Braille and Talking Book Library
1,031
Brooklyn
Coney Island
1,003
Brooklyn
Parkchester Branch
9,462
Bronx
Castle Hill Branch
5,980
Bronx
Wakefield Branch
3,630
Bronx
Bronx Library Center
3,018
Bronx
High Bridge Branch
1,832
Bronx
West Farms Branch
1,788
Bronx
Melrose Branch
1,531
Bronx
Hunts Point Branch
1,293
Bronx
Edenwald Branch
1,059
Bronx
Baychester Branch
1,039
Bronx
50 NYC Library Branches With the Highest Percentage Increases in Tech Training Attendance, 2012–2015
Branch
FY12
FY15
Change FY12–FY15
% Change FY12–FY15
Borough
Sheepshead Bay
74
866
792
1070%
Brooklyn
Saratoga
70
698
628
897%
Brooklyn
Kings Bay
192
1646
1454
757%
Brooklyn
Red Hook
64
469
405
633%
Brooklyn
Central Library Learning Center
379
2656
2277
601%
Brooklyn
Bedford
74
487
413
558%
Brooklyn
Eastern Parkway Learning Center
222
1065
843
380%
Brooklyn
Bedford Learning Center
183
846
663
362%
Brooklyn
Crown Heights
164
652
488
298%
Brooklyn
Kings Highway
944
2975
2031
215%
Brooklyn
Sunset Park
253
717
464
183%
Brooklyn
Brooklyn Central
1685
3967
2282
135%
Brooklyn
East Flatbush
357
832
475
133%
Brooklyn
Bay Ridge
274
609
335
122%
Brooklyn
Cortelyou
664
1382
718
108%
Brooklyn
Parkchester Branch
753
9462
8709
1157%
Bronx
Castle Hill Branch
500
5980
5480
1096%
Bronx
Wakefield Branch
436
3630
3194
733%
Bronx
Melrose Branch
278
1531
1253
451%
Bronx
West Farms Branch
342
1788
1446
423%
Bronx
Hunts Point Branch
272
1293
1021
375%
Bronx
Morris Park Branch
212
908
696
328%
Bronx
Edenwald Branch
261
1059
798
306%
Bronx
Baychester Branch
270
1039
769
285%
Bronx
Westchester Square Branch
240
863
623
260%
Bronx
High Bridge Branch
588
1832
1244
212%
Bronx
Mosholu Branch
301
791
490
163%
Bronx
Throgs Neck Branch
213
481
268
126%
Bronx
Mott Haven Branch
440
928
488
111%
Bronx
Richmondtown Branch
39
642
603
1546%
Staten Island
St. George Library Center
461
1350
889
193%
Staten Island
Epiphany Branch
17
741
724
4259%
Manhattan
Columbus Branch
140
2091
1951
1394%
Manhattan
New Amsterdam Branch
68
535
467
687%
Manhattan
Countee Cullen Branch
612
4486
3874
633%
Manhattan
Chatham Square Branch
652
3770
3118
478%
Manhattan
Roosevelt Island Branch
105
508
403
384%
Manhattan
Morningside Heights
1750
7454
5704
326%
Manhattan
Yorkville Branch
261
1109
848
325%
Manhattan
Harlem Branch
128
507
379
296%
Manhattan
Inwood Branch
283
1058
775
274%
Manhattan
Seward Park Branch
504
1749
1245
247%
Manhattan
Andrew Heiskell Braille and Talking Book Library
339
1031
692
204%
Manhattan
Queens Central–Children's Library
23
664
641
2787%
Queens
Queens Central
193
3312
3119
1616%
Queens
Rochdale Village Branch
66
1059
993
1505%
Queens
Laurelton Branch
115
1211
1096
953%
Queens
Woodside Branch
166
685
519
313%
Queens
Far Rockway Branch
141
523
382
271%
Queens
Forest Hills Branch
278
920
642
231%
Queens
This analysis includes only those branches whose tech training programs had at least 500 attendees in 2015.
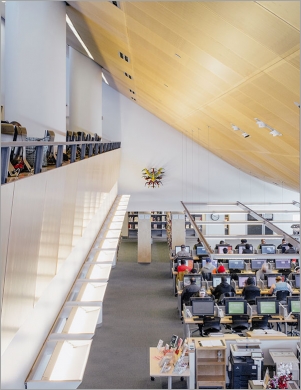
LIBRARIES TEACH TECH is a publication of the Center for an Urban Future written by Jonathan Bowles, researched by Kathleen Gorman, edited by Eli Dvorkin, and designed by Ahmad Dowla. Photo of Bronx Library Center by Ross Mantle.
This data analysis is part of a series of research briefs on New York City public libraries that was generously funded by the Charles H. Revson Foundation.
General operating support for the Center for an Urban Future (CUF) is provided by the Bernard F. and Alva B. Gimbel Foundation, with additional support from the Lucius N. Littauer Foundation and the M&T Charitable Foundation.
Center for an Urban Future is a catalyst for smart and sustainable policies that reduce inequality, increase economic mobility, and grow the economy in New York City. An independent, nonpartisan policy organization, we use fact-based research to elevate important and often overlooked issues onto the radar of policymakers and advance practical solutions that strengthen New York and help all New Yorkers participate in the city’s rising prosperity.