

Data - May 2024
Preparing for the End of the Affordable Connectivity Program in New York CityFew places nationally have benefited from the Affordable Connectivity Program (ACP) as much as New York City. With full funding for the program expiring at the end of April, nearly one million households across the five boroughs are poised to lose this subsidy—with the most significant impact felt in the city’s lowest-income communities.

Data - March 2017
The Unkindest Cuts: New York Has the Most to Lose if the NEA Is AbolishedThe Trump administration's plans to dismantle the National Endowment for the Arts will hurt hard-working artists across the country. Nowhere will these cuts be felt more deeply than in New York City, which receives one out of five NEA grants, worth $15.5 million in 2016. These funds support everything from major museum exhibitions to upstart performance groups, and, above all, good jobs for thousands of New Yorkers.

Data - March 2017
Taking to TASC: Too Few New Yorkers Are Passing the High School Equivalency ExamAfter the New York State Department of Education switched from the GED to a new high school equivalency exam, TASC, in 2014, the number of New York adults obtaining their HSE fell by half. The Center’s report is a first-ever look at the number of the New Yorkers that are taking and passing the new HSE exam since New York State changed test providers.

Data - October 2016
Where Immigrant New Yorkers Go to WorkImmigrants form an essential part of New York City's workforce. This data brief reveals where the city's immigrants go to work, including industries with a surprisingly high proportion of immigrant workers and others where immigrants are almost completely left out.

Data - September 2016
Jobs in Transit: Opportunity in the Transportation SectorThe transportation sector is growing in New York City, creating opportunities for accessible middle-wage jobs across the five boroughs. This data brief, the latest publication of our Middle Class Jobs Project, documents the industry's recent job gains, which have outpaced the city's overall economic growth over the past two years.
Data - July 2016
Data from Making It Here: The Future of Manufacturing in New York CityThe following data is part of CUF's 2016 Making It Here report. The report explores the new wave of modern manufacturing companies that are adding jobs across New York City, with a focus on three industries: 3D printing, wood and metal fabrication, and food.

Data - June 2016
Libraries Teach Tech: Building Skills for a Digital WorldThis new data brief finds that NYC’s public libraries are playing an increasingly important role in helping New Yorkers develop the technology skills needed in today’s economy. It shows that the city’s libraries provided tech training to more than 150,000 New Yorkers in 2015, an 81 percent increase from just three years earlier.

Data - May 2016
The Rise (and Fall) of Middle Wage Industries in NYCWhile the share of middle income jobs in New York City has declined over the past couple of decades, there is evidence that industries with middle income wages are staging a bit of a comeback.

Data - May 2016
Brooklyn Design BoomOur new data brief highlights the growing importance of the design sector to New York City’s economy, and details that a disproportionate share of the growth in the sector is now occurring in Brooklyn. It shows that employment at architecture and design companies in Brooklyn increased by 86 percent between 2010 and 2014, significantly outpacing the growth citywide (23 percent) and in Manhattan (19 percent).

Data - March 2016
Library Times Are A-Changin’Our second annual assessment of library hours in New York shows that 40 percent more branch libraries in NYC are open at least six days a week than this time last year. But while city libraries are open an average of 4 hours more per week than a year ago, they still lag behind many of the largest library systems in the state and nation in hours of operation.

Data - March 2016
Fast City, Slow CommuteNew Yorkers are efficient, direct and fast moving. Their commutes: anything but. In this data analysis, we examine New Yorkers’ commutes by neighborhood and across industries.

Data - March 2016
Women-Owned Businesses in the Nation’s 25 Largest CitiesThis index provides data on women-owned businesses in each of the nation’s 25 largest cities, including the overall number of women-owned firms, the growth rate for women-owned businesses and male-owned businesses, and average revenues per women-owned business.
Data - March 2016
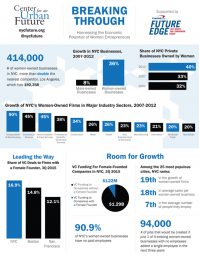
Data from Breaking ThroughCharts and tables from our 2016 Breaking Through study. The report found that though women entrepreneurs of all ages, races and ethnicities are having an increasingly large impact on New York City’s economy, the city has only begun to harness the full potential of women entrepreneurs.

Data - November 2015
Manufacturing in NYC: A SnapshotThis data analysis, the inaugural publication of the Center for an Urban Future’s Middle Class Jobs Project, provides a new level of detail about New York City’s manufacturing sector. It reveals that the city has gained nearly 1,000 manufacturing jobs since 2011, reversing a long decline, and documents which manufacturing subsectors in the five boroughs are growing the fastest.
Data - October 2015
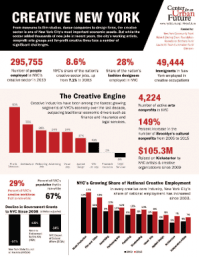
Creative New York, At A GlanceFrom museums to film studios, dance companies to design firms, the creative sector is one of New York City’s most important economic assets. Using data from CUF's 2015 Creative New York report, this infographic shows the incredible growth, as well as the ongoing challenges of the city’s creative industries.

Data - August 2015
NYC’s Tech ProfileThis analysis offers a fresh look at New York City’s tech sector. Using the Federal Reserve Bank of New York’s new definition of tech industries, our analysis documents employment growth by borough and subsector and offers a demographic profile by age, sex and race/ethnicity.

Data - July 2015
Parks Facilities, How the Boroughs CompareNew York is home to the country’s oldest, busiest and most expansive parks. These facilities, however, are not equally distributed across the city’s neighborhoods and boroughs. In this data brief, we look at the per capita distribution of Department of Parks and Recreation pools, tennis courts, handball courts and baseball diamonds.
Data - June 2015
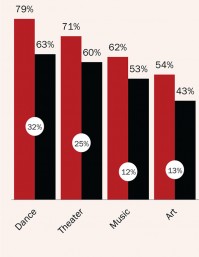
Data from Creative New YorkCharts and tables from our 2015 Creative New York study. The report found that the creative sector is one of New York City’s most important economic assets but that the city’s working artists, nonprofit arts groups and for-profit creative firms face a growing number of challenges.

Data - June 2015
NYC Libraries by the NumbersDespite declining funds and limited hours of service, New York City’s public libraries are seeing a surge in users and uses. Below we show where the growth is happening and how funding cuts in recent years have affected performance, and provide the city’s first branch-by-branch accounting of book circulation, program attendance and visits.
Data - May 2015
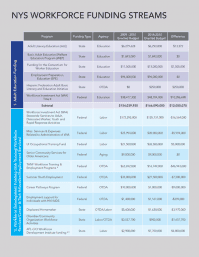
NYS Workforce Funding StreamsThese three tables from our Seeking a State Workforce Strategy report track public workforce development funds by program and relate these programs to three larger categories for investment: 1) adult education funding 2) workforce development funding and 3) college access and workforce services in higher education. The tables also indicate where programs receive their funding, what agency or department oversees them and how their funding has changed in the past five years.