Despite declining funds and limited hours of service, New York City’s public libraries are seeing a surge in users and uses. Below we show where the growth is happening and how funding cuts in recent years have affected performance, and provide the city’s first branch-by-branch accounting of book circulation, program attendance and visits.
In today’s information economy, New York City’s public libraries have become dynamic learning environments with an uncommonly wide range of services and resources. No longer just book repositories, libraries are places where teens can geek out on computers, the unemployed can improve their resumes, and immigrants can learn and practice English. They are community spaces where people are encouraged to share stories and impart advice, where volunteers can donate their skills and teach a class on knitting or film editing. They are platforms for community organizations and neighborhood groups, and resources for budding entrepreneurs and hobbyists.
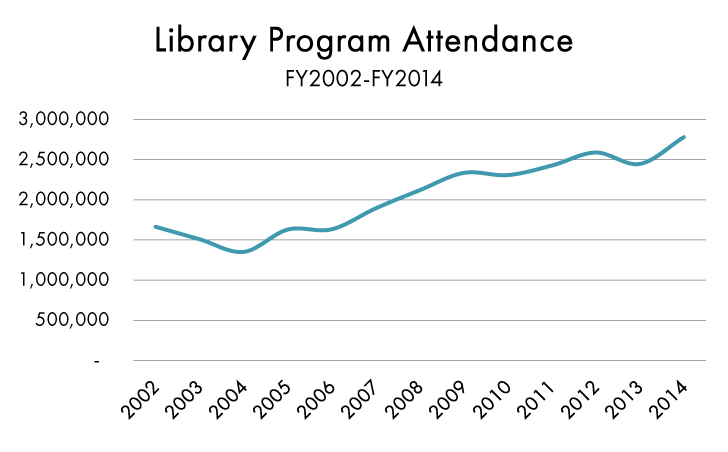
Since the early 2000s, New York City’s 207 library branches have leveraged their status as community anchors and their ability to draw on volunteers as well as librarians and other trained staff to dramatically increase the number and type of public programs on offer. Between Fiscal Years 2002 and 2014, annual attendance at these programs increased by 67 percent, or 1.1 million attendees. In Fiscal Year 2014, nearly 2.8 million New Yorkers attended a class or workshop or some other event at their local library, compared to just 1.7 million in Fiscal Year 2002. With the advent of e-lending and the proliferating selection of downloadable materials, circulation has been on the rise over the last 13 years as well. Since Fiscal Year 2002, checkouts of both physical and electronic books and other items has risen 30 percent, going from 43.4 million materials in 2002 to 56.3 million in 2014.
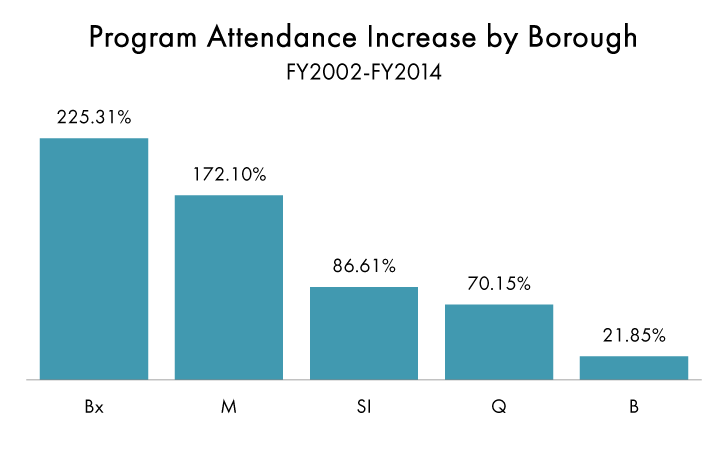
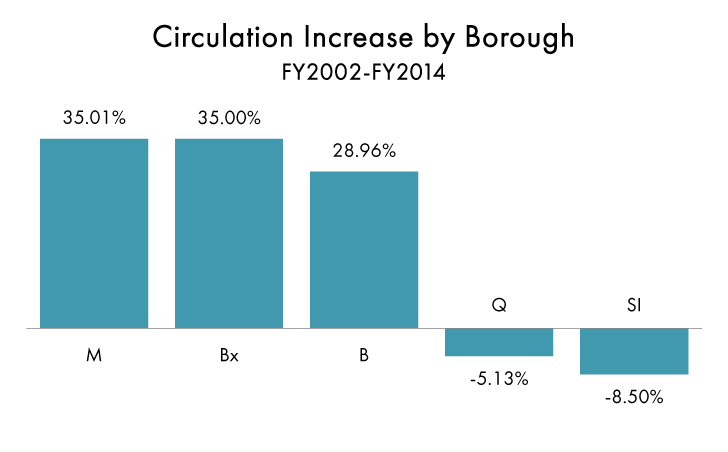
Whether it is program attendance or circulation, no borough has seen bigger increases over this period than the Bronx. Between 2002 and 2014, libraries in the Bronx experienced a 225 percent increase in attendees at public programs, while Manhattan libraries jumped 172 percent, Staten Island branches 87 percent, Queens branches 70 percent, and Brooklyn branches 22 percent over the same period. Since 2002, branches in both Manhattan and the Bronx have experienced a 35 percent rise in circulation, while Brooklyn libraries saw a 29 percent rise. Circulation dropped in Queens (-5 percent) and Staten Island (-9 percent) over this period.
Among the top 50 libraries by annual visitors, Manhattan has 15, Queens 15, Brooklyn 12, the Bronx 6 and Staten Island 2. Unsurprisingly, the city’s five large regional libraries—including Brooklyn Central, Queens Central, Mid-Manhattan, Flushing and the Bronx Library Center—attract the most library patrons. Every year, these five libraries see a combined 6.4 million people walk through their doors, welcome 288,000 attendees in their public programs and check-out 8.8 million materials. But a number of other relatively small neighborhood branches attract an enormous number of patrons every year, including Kings Highway, McKinley Park, New Utrecht, Midwood and Jackson Heights, all of which are in the top ten citywide by circulation, or Ridgewood, Long Island City, Seward Park, Riverside and Clason’s Point, which are in the top ten by program attendance. Among New York’s smallest libraries (10,000 square feet or less), McKinley Park, Corona, Sunnyside, 58th Street, Lefferts, Windsor Terrace, and Cortelyou are all extremely popular branches, with each having over 200,000 visitors per year.
Remarkably, the city’s three public library systems—including the New York Public Library, which covers the Bronx, Manhattan and Staten Island, the Brooklyn Public Library and Queens Library—have managed to expand programming and attract new patrons in a flat or even slightly negative funding environment. Operating support from the city, which is so critical for keeping the doors open, the branches staffed, and the collection of books and other resources up-to-date, has declined by 4 percent in inflation adjusted dollars since Fiscal Year 2002.
Funding cuts after the September 11th terrorist attacks and then again after a full restoration of six-day service in 2008 caused the libraries to reduce staff and service hours and cut way back on the purchase of new materials. Since Fiscal Year 2009, when the libraries received over $360 million in subsidies (inflation adjusted), a bump due in small part to retroactive payments to unionized staff, funding has dropped 10 percent. And although program attendance figures have continued to rise over that period, circulation has dropped significantly. After reaching a peak of 69 million materials in 2011, circulation dropped 18 percent to 56 million materials in 2014.
As detailed in table VIII, Mayor de Blasio’s Executive Budget does not increase funding over the next four years. The three library systems estimate that the funding level proposed for Fiscal Year 2016 will have to rise $65 million in order to reach the level of service last seen in 2008 and 2009.
I. Library Program Attendance Citywide: FY2002-FY2014
Fiscal Year
Total Program Attendance
Total Percent Change
2002
1,664,275
2003
1,508,998
-9%
2004
1,352,330
-10%
2005
1,629,919
21%
2006
1,633,574
0%
2007
1,894,028
16%
2008
2,120,199
12%
2009
2,335,063
10%
2010
2,307,933
-1%
2011
2,426,767
5%
2012
2,588,543
7%
2013
2,447,176
-5%
2014
2,779,603
14%
II. Library Circulation Citywide: FY2002-FY2014
Fiscal Year
Total Systemwide Circulation
Total Percent Change
2002
43,353,000
2003
41,600,000
-4%
2004
41,828,000
1%
2005
48,445,000
16%
2006
52,006,000
7%
2007
54,088,000
4%
2008
59,235,000
10%
2009
62,450,000
5%
2010
66,623,000
7%
2011
68,797,000
3%
2012
63,531,646
-8%
2013
60,880,350
-4%
2014
56,322,079
-7%
III. Program Attendance and Circulation by Borough: FY2002-FY2014
Circulation
Program Attendance
FY2002
FY 2012
FY 2013
FY 2014
FY2002
FY2012
FY2013
FY 2014
PA %Change 02-14
Circ %Change 02-14
Bronx
3,090,589
4,860,377
4,477,150
4,172,435
142,377
411,317
441,420
463,165
225%
35%
Brooklyn
11,304,059
18,690,259
16,501,362
14,577,594
567,519
755,378
596,989
691,508
22%
29%
Manhattan
7,988,839
12,146,598
11,285,419
10,785,861
216,362
510,065
550,230
588,720
172%
35%
Queens
15,554,882
17,238,193
15,959,847
14,756,917
453,080
684,295
652,571
770,927
70%
-5%
Staten Island
2,279,056
2,288,290
2,133,008
2,085,438
73,861
114,342
107,482
137,835
87%
-8%
IV. Top 50 Branches by Circulation
Branch Location
Borough
2014 Circulation
Flushing
Q
2,226,973
Mid-Manhattan Library
M
2,186,713
Brooklyn Central
B
1,926,743
Queens Central
Q
1,887,017
Kings Highway
B
1,110,905
McKinley Park
B
772,039
New Utrecht
B
604,442
Midwood
B
592,052
Bronx Library Center
Bx
585,909
Jackson Heights
Q
559,445
Andrew Heiskell
M
551,829
Bayside
Q
540,879
Forest Hills
Q
540,615
Todt Hill-Westerleigh
SI
515,801
Glen Oaks
Q
477,261
Fresh Meadows
Q
475,547
Borough Park
B
469,029
Chatham Square
M
437,793
Kensington
B
429,437
Sunset Park
B
412,211
Seward Park
M
405,347
Kings Bay
B
402,708
St. Agnes
M
388,533
Bay Ridge
B
388,038
Jefferson Market
M
383,479
Ryder
B
379,626
Mapleton
B
374,832
Highlawn
B
374,824
Riverside
M
361,857
Morningside Heights (Columbia)
M
358,626
Brooklyn Heights
B
353,816
New Amsterdam
M
348,592
Park Slope
B
344,140
Broadway
Q
331,146
58th Street
M
311,124
Bloomingdale
M
298,969
Steinway
Q
295,668
Ulmer Park
B
289,861
Hillcrest
Q
288,447
Sunnyside
Q
284,316
Parkchester
Bx
283,408
Brighton Beach
B
281,335
Windsor Terrace
B
276,860
Flatlands
B
272,725
McGoldrick
Q
272,693
Muhlenberg
M
269,157
67th Street
M
268,726
Inwood
M
268,701
Fort Washington
M
265,675
Mulberry Street
M
265,333
V. Top 50 Branches by Program Attendance
Branch Name
Borough
FY 2014
Bronx Library Center
Bx
65,859
Queens Central
Q
61,948
Flushing
Q
58,923
Brooklyn Central
B
56,219
Mid-Manhattan Library
M
45,202
Ridgewood
Q
42,486
Long Island City
Q
39,777
Seward Park
M
38,807
Riverside
M
38,093
Clason's Point
Bx
35,951
Steinway
Q
34,637
Sheepshead Bay
B
34,196
Bay Ridge
B
31,181
Corona
Q
30,153
Parkchester
Bx
27,602
Leonard
B
26,878
Richmond Hill
Q
25,684
Kings Highway
B
24,667
Battery Park City
M
23,582
St. George Library
SI
22,974
Woodside
Q
22,028
Chatham Square
M
21,957
St. Agnes
M
21,677
Forest Hills
Q
21,458
Jefferson Market
M
21,458
Jackson Heights
Q
21,357
Brooklyn Heights
B
21,293
Hamilton Grange
M
20,964
New Utrecht
B
20,771
Langston Hughes
Q
20,717
Kings Bay
B
20,184
67th Street
M
19,948
Morningside Heights (Columbia)
M
19,651
Kips Bay
M
19,147
Pacific
B
18,782
Midwood
B
18,683
Westchester Square
Bx
18,532
Flatbush
B
18,395
New Dorp
SI
18,336
Lefferts
Q
18,225
Morrisania
Bx
18,185
Briarwood
Q
18,021
Muhlenberg
M
17,826
Harlem
M
17,650
Inwood
M
17,626
Mulberry Street
M
17,618
Queens Village
Q
16,905
Windsor Terrace
B
16,522
Crown Heights
B
16,421
Sunnyside
Q
16,187
VI. Top 50 Branches by Visits
Branch Name
Borough
FY 2014
Flushing
Q
1,727,541
Queens Central
Q
1,451,611
Mid-Manhattan Library
M
1,306,240
Brooklyn Central
B
1,194,494
Bronx Library Center
Bx
718,085
Jackson Heights
Q
445,970
Kings Highway
B
378,306
Forest Hills
Q
335,443
Seward Park
M
326,264
Chatham Square
M
300,877
Broadway
Q
294,241
Jefferson Market
M
287,007
McKinley Park
B
284,592
Riverside
M
281,223
Brooklyn Heights
B
278,315
Ridgewood
Q
270,604
Morningside Heights (Columbia)
M
254,470
St. Agnes
M
250,958
Parkchester
Bx
249,572
New Amsterdam
M
243,047
Corona
Q
240,466
New Utrecht
B
238,219
Steinway
Q
231,405
Sunnyside
Q
228,325
Inwood
M
227,135
58th Street
M
225,259
Lefferts
Q
219,039
Windsor Terrace
B
217,865
Cortelyou
B
217,463
Sunset Park
B
215,758
St. George Library
SI
214,281
Bayside
Q
207,105
Bloomingdale
M
205,212
Mott Haven
Bx
203,280
Cambria Heights
Q
200,226
Rego Park
Q
196,552
Mosholu
Bx
195,361
Todt Hill-Westerleigh
SI
193,236
Kingsbridge
Bx
193,138
Belmont
Bx
192,307
Countee Cullen
M
191,778
Muhlenberg
M
190,238
Bay Ridge
B
189,689
Kensington
B
186,295
Fresh Meadows
Q
185,922
Kings Bay
B
184,905
Far Rockaway
Q
184,711
Hamilton Grange
M
183,745
Grand Central
M
183,390
Midwood
B
181,471
VII. Top 50 Small Branches
Branch Name
Borough
Building Square Feet
Visits 2014
Circulation 2014
Program Att 2014
McKinley Park
B
7,639
284,592
772,039
7,855
Corona
Q
10,000
240,466
253,363
30,153
Sunnyside
Q
7,500
228,325
284,316
16,187
58th Street
M
8,036
225,259
311,124
9,792
Lefferts
Q
7,500
219,039
197,895
18,225
Windsor Terrace
B
7,462
217,865
276,860
16,522
Cortelyou
B
7,495
217,463
245,145
11,642
Rego Park
Q
7,500
196,552
238,081
4,889
Fresh Meadows
Q
8,700
185,922
475,547
8,015
Far Rockaway
Q
9,060
184,711
156,770
11,106
Baychester
Bx
10,000
169,829
122,917
5,811
Clason's Point
Bx
10,000
169,781
142,302
35,951
Kips Bay
M
9,400
164,911
193,684
19,147
Melrose
Bx
9,927
164,742
129,862
11,184
Greenpoint
B
7,301
161,370
236,430
11,879
Spuyten Duyvil
Bx
7,500
157,449
197,367
5,550
Maspeth
Q
7,500
151,914
239,963
3,993
McGoldrick
Q
7,500
148,987
272,693
13,458
Highlawn
B
7,676
148,262
374,824
10,553
Ottendorfer
M
8,332
138,452
172,882
13,091
Van Nest
Bx
7,690
132,826
112,287
11,950
Hillcrest
Q
7,600
130,215
288,447
3,576
Laurelton
Q
9,000
128,504
105,659
14,648
Mitchell-Linden
Q
8,800
127,084
199,643
8,387
Briarwood
Q
7,500
125,970
190,152
18,021
Fort Hamilton
B
7,010
125,047
180,915
6,562
Rochdale Village
Q
7,500
125,034
78,723
6,732
Windsor Park
Q
7,500
122,920
216,756
7,193
Canarsie
B
6,811
120,332
73,421
4,497
South Hollis
Q
7,500
119,400
56,097
6,048
Ryder
B
7,538
114,502
379,626
5,532
Ulmer Park
B
8,326
113,148
289,861
6,591
Morris Park
Bx
6,300
111,584
123,977
12,623
Edenwald
Bx
7,500
110,482
100,716
15,553
Eastchester
Bx
7,500
110,173
94,160
6,947
North Hills
Q
6,000
109,273
143,171
9,935
Woodhaven
Q
9,100
105,753
134,826
10,976
Bay Terrace
Q
7,500
103,805
132,403
12,969
Sheepshead Bay
B
7,672
102,059
250,689
34,196
Howard Beach
Q
7,500
102,022
154,420
4,151
Jerome Park
Bx
7,404
100,688
60,973
6,162
Pelham Bay
Bx
10,000
100,553
108,632
14,651
Mill Basin
B
7,307
99,618
168,496
8,455
Cypress Hills
B
6,999
98,368
86,674
12,786
St. Albans
Q
7,510
97,817
89,860
3,533
Pomonok
Q
7,500
97,163
122,853
9,515
Whitestone
Q
7,500
97,016
166,614
3,904
Rosedale
Q
5,400
95,724
73,988
6,915
Kew Gardens Hills
Q
8,400
94,591
130,911
1,222
Hollis
Q
7,500
94,008
121,039
5,242
VIII. City Subsidies to Library Operating Budgets: FY2002-FY2019
Year
Real
Nominal
2002
$335,509,000
$255,107,000
2003
$296,186,000
$230,340,000
2004
$296,331,000
$236,590,000
2005
$302,879,000
$250,011,000
2006
$306,477,000
$261,141,000
2007
$321,778,000
$281,988,000
2008
$345,578,000
$314,473,000
2009
$360,294,000
$326,698,000
2010
$337,231,000
$310,801,000
2011
$311,333,000
$295,990,000
2012
$308,174,000
$299,050,000
2013
$303,296,000
$298,627,000
2014
$302,856,000
$303,031,000
2015
$323,311,000
$323,311,000
2016
N/A
$313,859,000
2017
N/A
$319,229,000
2018
N/A
$320,503,000
2019
N/A
$320,504,000
Sources: IBO; Mayor's Office of Management and Budget; New York City Comptroller's Comprehensive Annual Financial Report (CAFR). Figures for FY 02-14 are actual expenditures as reported in the CAFRs. Figures for FY 15-19 are from the FY 16 Executive Budget. Inflation adjustments were made with the Bureau of Labor Statistic's Inflation Calculator and use 2015 constant dollars. Totals include city subsidies to NYPL's four research library locations.
IX. Branch by Branch Circulation
Branch Name
Borough
System
FY2002
FY 2012
FY 2013
FY 2014
115th Street
M
NYPL
62,955
145,027
128,666
123,523
125th Street
M
NYPL
38,089
87,636
83,025
25,123
58th Street
M
NYPL
256,084
362,513
340,142
311,124
67th Street
M
NYPL
202,143
287,447
286,961
268,726
96th Street
M
NYPL
191,327
342,366
185,025
215,452
Aguilar
M
NYPL
102,289
211,122
210,938
197,649
Allerton
Bx
NYPL
116,519
129,891
114,085
96,529
Andrew Heiskell
M
NYPL
378,199
386,741
348,185
551,829
Arlington
B
BPL
73,162
150,596
96,283
75,214
Arverne
Q
QPL
51,329
83,298
62,805
125,934
Astoria
Q
QPL
87,018
96,136
98,731
91,762
Auburndale
Q
QPL
397,511
253,183
236,383
186,823
Baisley Park
Q
QPL
69,869
87,492
86,598
62,149
Battery Park City
M
NYPL
289,734
264,193
263,311
Bay Ridge
B
BPL
224,761
520,467
445,348
388,038
Bay Terrace
Q
QPL
169,582
174,797
169,808
132,403
Baychester
Bx
NYPL
177,005
158,708
138,090
122,917
Bayside
Q
QPL
568,070
684,198
310,613
540,879
Bedford
B
BPL
39,142
94,920
66,635
69,126
Bellerose
Q
QPL
373,334
272,112
245,158
75,626
Belmont
Bx
NYPL
90,385
122,131
114,437
103,119
Bloomingdale
M
NYPL
297,165
371,263
374,328
298,969
Borough Park
B
BPL
226,542
577,597
540,181
469,029
Brooklyn Central
B
BPL
1,548,102
2,570,201
2,273,551
1,926,743
Briarwood
Q
QPL
219,928
219,322
210,858
190,152
Brighton Beach
B
BPL
310,262
385,155
289,840
281,335
Broad Channel
Q
QPL
65,283
59,692
45,156
94,748
Broadway
Q
QPL
392,701
375,554
348,237
331,146
Bronx Library Center
Bx
NYPL
198,627
541,977
624,979
585,909
Brooklyn Heights
B
BPL
337,428
487,040
425,517
353,816
Brower Park
B
BPL
78,518
93,521
79,984
61,050
Brownsville
B
BPL
58,931
73,066
54,754
43,978
Bushwick
B
BPL
57,458
104,423
93,780
70,972
Cambria Heights
Q
QPL
100,966
132,532
138,605
132,727
Canarsie
B
BPL
136,186
115,949
101,408
73,421
Carroll Gardens
B
BPL
67,322
209,862
131,153
153,032
Castle Hill
Bx
NYPL
68,160
72,886
64,895
62,011
Chatham Square
M
NYPL
510,574
533,500
449,669
437,793
City Island
Bx
NYPL
38,347
41,542
37,717
34,049
Clarendon
B
BPL
114,107
148,373
105,911
84,145
Clason's Point
Bx
NYPL
81,998
147,630
131,260
142,302
Clinton Hill
B
BPL
63,961
179,797
173,881
83,641
Columbus
M
NYPL
88,492
200,119
174,985
138,015
Coney Island
B
BPL
106,396
190,243
76,504
69,688
Corona
Q
QPL
178,302
304,451
297,744
253,363
Cortelyou
B
BPL
48,855
155,040
272,829
245,145
Countee Cullen
M
NYPL
85,937
175,374
167,923
154,734
Court Square
Q
QPL
125,753
98,037
99,739
71,368
Crown Heights
B
BPL
65,584
281,278
228,410
218,584
Cypress Hills
B
BPL
86,864
117,841
98,640
86,674
Dekalb
B
BPL
80,222
106,524
106,310
88,253
Dongan Hills
SI
NYPL
162,888
145,215
118,187
109,604
Douglaston
Q
QPL
193,183
159,266
160,724
128,562
Dyker
B
BPL
228,499
339,825
331,699
237,259
East Elmhurst
Q
QPL
75,811
75,154
74,610
69,956
East Flatbush
B
BPL
109,885
116,406
81,385
77,428
East Flushing
Q
QPL
166,351
154,590
178,072
145,728
Eastchester
Bx
NYPL
88,060
108,494
99,028
94,160
Eastern Parkway
B
BPL
110,870
179,069
165,978
146,233
Edenwald
Bx
NYPL
35,430
125,081
104,690
100,716
Elmhurst
Q
QPL
662,596
365,274
361,481
364,780
Epiphany
M
NYPL
258,459
308,475
287,415
187,365
Far Rockaway
Q
QPL
171,223
191,046
178,482
156,770
Flatbush
B
BPL
141,915
147,931
134,351
101,248
Flatlands
B
BPL
291,460
366,062
300,803
272,725
Flushing
Q
QPL
1,441,741
2,559,888
2,352,337
2,226,973
Forest Hills
Q
QPL
391,358
632,864
593,701
540,615
Fort Hamilton
B
BPL
177,549
223,998
210,707
180,915
Fort Washington
M
NYPL
192,281
325,817
299,491
265,675
Francis Martin
Bx
NYPL
111,165
97,161
83,914
70,804
Fresh Meadows
Q
QPL
456,809
819,815
792,939
475,547
George Bruce
M
NYPL
95,200
113,134
113,788
108,061
Gerritsen Beach
B
BPL
159,364
239,477
94,151
72,473
Glen Oaks
Q
QPL
231,673
169,048
183,468
477,261
Glendale
Q
QPL
141,439
110,072
108,342
94,574
Grand Central
M
NYPL
302,163
248,698
257,566
Grand Concourse
Bx
NYPL
1,766
148,543
130,716
115,898
Gravesend
B
BPL
189,610
288,992
163,832
196,187
Great Kills
SI
NYPL
125,829
145,084
131,897
119,216
Greenpoint
B
BPL
187,441
280,076
232,500
236,430
Hamilton Fish Park
M
NYPL
77,436
154,402
140,161
138,414
Hamilton Grange
M
NYPL
53,544
199,735
185,388
179,586
Harlem
M
NYPL
31,313
103,868
94,066
98,463
High Bridge
Bx
NYPL
77,606
112,705
99,675
88,473
Highlawn
B
BPL
296,779
477,571
458,237
374,824
Hillcrest
Q
QPL
357,952
248,604
256,935
288,447
Hollis
Q
QPL
131,148
136,850
141,789
121,039
Homecrest
B
BPL
223,322
265,630
230,839
189,962
Howard Beach
Q
QPL
187,798
144,554
153,920
154,420
Hudson Park
M
NYPL
103,488
146,223
124,344
58,930
Huguenot Park
SI
NYPL
242,005
231,198
214,456
196,181
Hunt's Point
Bx
NYPL
60,356
116,702
119,440
107,575
Inwood
M
NYPL
233,643
300,266
279,955
268,701
Jackson Heights
Q
QPL
559,040
666,910
631,155
559,445
Jamaica Bay
B
BPL
60,279
106,936
78,415
70,732
Jefferson Market
M
NYPL
341,956
353,722
356,236
383,479
Jerome Park
Bx
NYPL
83,124
93,939
68,433
60,973
Kensington
B
BPL
226,882
444,013
452,541
429,437
Kew Gardens Hills
Q
QPL
302,564
282,233
219,818
130,911
Kings Bay
B
BPL
305,766
460,899
478,262
402,708
Kings Highway
B
BPL
536,184
1,385,482
1,254,517
1,110,905
Kingsbridge
Bx
NYPL
151,316
285,189
220,412
203,669
Kips Bay
M
NYPL
171,563
194,638
183,774
193,684
Langston Hughes
Q
QPL
79,309
110,510
123,673
112,423
Laurelton
Q
QPL
117,558
120,789
115,293
105,659
Lefferts
Q
QPL
336,594
255,937
248,391
197,895
Lefrak City
Q
QPL
172,356
143,707
132,787
115,138
Leonard
B
BPL
121,311
155,846
159,234
154,001
Long Island City
Q
QPL
216,593
180,201
178,637
Macomb's Bridge
M
NYPL
8,739
40,843
49,127
45,363
Macon
B
BPL
72,093
83,382
96,327
74,401
Mapleton
B
BPL
351,382
651,720
489,367
374,832
Marcy
B
BPL
26,178
112,216
91,901
91,802
Mariners Harbor
SI
NYPL
93
47
46,605
Maspeth
Q
QPL
256,781
257,998
261,415
239,963
McGoldrick
Q
QPL
290,964
318,326
280,746
272,693
McKinley Park
B
BPL
495,643
841,533
826,190
772,039
Melrose
Bx
NYPL
90,901
160,285
139,620
129,862
Middle Village
Q
QPL
121,734
106,621
103,786
97,122
Mid-Manhattan Library
M
NYPL
1,937,221
2,493,597
2,370,048
2,186,713
Midwood
B
BPL
412,816
656,701
617,192
592,052
Mill Basin
B
BPL
193,087
205,179
180,138
168,496
Mitchell-Linden
Q
QPL
265,387
291,494
281,258
199,643
Morningside Heights (Columbia)
M
NYPL
286,597
388,161
356,235
358,626
Morris Park
Bx
NYPL
152,820
137,280
123,977
Morrisania
Bx
NYPL
54,004
97,338
80,014
73,363
Mosholu
Bx
NYPL
121,902
230,489
205,987
181,693
Mott Haven
Bx
NYPL
78,910
120,258
119,590
111,250
Muhlenberg
M
NYPL
184,449
309,279
292,957
269,157
Mulberry Street
M
NYPL
302,248
272,963
265,333
New Amsterdam
M
NYPL
210,725
379,851
360,293
348,592
New Dorp
SI
NYPL
238,666
228,419
209,129
195,258
New Lots
B
BPL
79,652
125,671
104,630
86,909
New Utrecht
B
BPL
368,148
874,257
668,724
604,442
No. Forest Park
Q
QPL
205,692
192,211
188,204
165,963
North Hills
Q
QPL
126,528
197,384
174,541
143,171
Ottendorfer
M
NYPL
96,716
204,031
171,146
172,882
Ozone Park
Q
QPL
207,679
229,807
218,363
156,113
Pacific
B
BPL
58,873
116,491
132,940
123,531
Paerdegat
B
BPL
111,092
113,671
88,961
76,235
Park Slope
B
BPL
183,216
2,266
305,464
344,140
Parkchester
Bx
NYPL
194,562
311,719
289,589
283,408
Pelham Bay
Bx
NYPL
105,602
120,855
110,445
108,632
Peninsula
Q
QPL
123,768
114,419
65,500
57,641
Pomonok
Q
QPL
131,433
111,901
123,558
122,853
Poppenhusen
Q
QPL
129,670
110,668
115,413
107,386
Port Richmond
SI
NYPL
87,090
106,527
89,258
78,764
Queens Central
Q
QPL
1,926,229
1,943,564
2,013,740
1,887,017
Queens Village
Q
QPL
212,298
184,810
162,833
152,806
Queensboro Hill
Q
QPL
263,506
142,699
1,120
35,221
Red Hook
B
BPL
25,172
47,303
29,670
40,485
Rego Park
Q
QPL
386,221
281,772
265,351
238,081
Richmond Hill
Q
QPL
283,503
239,125
225,643
209,518
Richmondtown
SI
NYPL
302,501
217,817
256,281
239,973
Ridgewood
Q
QPL
235,053
224,129
236,420
227,205
Riverdale
Bx
NYPL
120,116
123,662
124,637
119,301
Riverside
M
NYPL
241,447
356,711
361,325
361,857
Rochdale Village
Q
QPL
95,072
101,856
97,607
78,723
Roosevelt Island
M
NYPL
60,870
115,757
119,656
113,428
Rosedale
Q
QPL
125,142
106,703
98,490
73,988
Rugby
B
BPL
58,050
126,557
111,387
88,144
Ryder
B
BPL
285,780
387,742
423,896
379,626
Saratoga
B
BPL
83,711
104,774
81,948
70,959
Seaside
Q
QPL
153,679
114,231
50,717
102,235
Sedgwick
Bx
NYPL
878
70,665
68,958
60,543
Seward Park
M
NYPL
225,241
463,276
434,716
405,347
Sheepshead Bay
B
BPL
231,595
395,896
186,166
250,689
Soundview
Bx
NYPL
69,249
108,359
90,086
84,311
South Beach
SI
NYPL
83,177
133,622
123,507
111,850
South Hollis
Q
QPL
46,628
91,416
81,191
56,097
South Jamaica
Q
QPL
74,012
68,844
71,858
69,201
South Ozone Park
Q
QPL
105,722
159,760
149,332
108,962
Spring Creek
B
BPL
62,429
95,950
87,191
73,923
Spuyten Duyvil
Bx
NYPL
178,285
219,017
203,411
197,367
St. Agnes
M
NYPL
309,430
397,784
392,145
388,533
St. Albans
Q
QPL
93,291
92,906
93,658
89,860
St. George Library
SI
NYPL
233,037
239,333
207,199
164,021
Stapleton
SI
NYPL
61,316
105
11,035
138,442
Steinway
Q
QPL
221,612
328,192
317,067
295,668
Stone Avenue
B
BPL
44,136
70,068
69,129
37,056
Sunnyside
Q
QPL
275,756
342,612
320,766
284,316
Sunset Park
B
BPL
301,770
540,340
487,215
412,211
Terence Cardinal Cooke
M
NYPL
122,119
135,315
107,374
60,627
Throg's Neck
Bx
NYPL
107,356
97,212
87,344
79,166
Todt Hill-Westerleigh
SI
NYPL
503,631
592,706
558,602
515,801
Tompkins Square
M
NYPL
161,861
183,557
172,000
166,709
Tottenville
SI
NYPL
128,827
107,834
82,838
73,591
Tremont
Bx
NYPL
56,529
82,634
73,129
64,332
Ulmer Park
B
BPL
252,348
413,858
329,868
289,861
Van Cortlandt
Bx
NYPL
90,682
78,765
74,564
72,302
Van Nest
Bx
NYPL
117,457
127,151
113,605
112,287
Wakefield
Bx
NYPL
73,483
100,842
90,956
82,031
Walt Whitman
B
BPL
41,084
74,151
66,990
64,282
Washington Heights
M
NYPL
93,655
395
65
42,358
Washington Irving
B
BPL
91,870
108,250
81,372
71,763
Webster
M
NYPL
236,216
231,100
227,069
West Farms
Bx
NYPL
47,685
77,941
66,274
61,794
West New Brighton
SI
NYPL
110,089
140,337
130,572
96,132
Westchester Square
Bx
NYPL
74,636
124,142
110,337
94,096
Whitestone
Q
QPL
236,730
198,951
180,596
166,614
Williamsburgh
B
BPL
102,247
162,724
147,119
117,505
Windsor Park
Q
QPL
233,751
243,699
245,676
216,756
Windsor Terrace
B
BPL
280,768
339,453
309,207
276,860
Woodhaven
Q
QPL
177,016
157,338
130,778
134,826
Woodlawn Heights
Bx
NYPL
60,383
73,183
62,305
63,913
Woodside
Q
QPL
236,472
245,523
227,148
198,195
Woodstock
Bx
NYPL
68,105
80,461
77,248
79,703
Yorkville
M
NYPL
277,632
244,292
266,913
247,095
X. Branch by Branch Program Attendance
Branch Name
Borough
System
FY2002
FY2012
FY2013
FY 2014
115th Street
M
NYPL
5,569
9,023
9,622
13,099
125th Street
M
NYPL
2,702
6,690
6,736
1,729
58th Street
M
NYPL
7,362
8,132
8,906
9,792
67th Street
M
NYPL
4,454
18,276
24,326
19,948
96th Street
M
NYPL
9,987
16,568
7,723
11,612
Aguilar
M
NYPL
16,519
13,074
13,364
13,148
Allerton
Bx
NYPL
1,860
4,972
6,444
7,008
Andrew Heiskell
M
NYPL
1,133
2,370
3,059
4,191
Arlington
B
BPL
8,966
8,213
4,834
7,704
Arverne
Q
QPL
4,969
4,904
5,335
6,490
Astoria
Q
QPL
8,628
10,023
10,682
14,084
Auburndale
Q
QPL
4,246
3,688
3,476
5,890
Baisley Park
Q
QPL
3,168
4,107
3,429
2,556
Battery Park City
M
NYPL
18,431
15,562
23,582
Bay Ridge
B
BPL
8,728
30,955
29,290
31,181
Bay Terrace
Q
QPL
3,706
12,703
14,458
12,969
Baychester
Bx
NYPL
5,513
7,940
7,539
5,811
Bayside
Q
QPL
8,714
8,307
2,902
10,333
Bedford
B
BPL
8,641
8,318
5,318
13,323
Bellerose
Q
QPL
5,947
4,630
2,994
814
Belmont
Bx
NYPL
7,521
13,925
16,302
14,542
Bloomingdale
M
NYPL
7,336
18,217
18,878
11,935
Borough Park
B
BPL
8,403
16,069
15,824
14,187
Brooklyn Central
B
BPL
34,759
62,025
48,165
56,219
Briarwood
Q
QPL
3,283
25,144
14,228
18,021
Brighton Beach
B
BPL
8,819
6,912
5,360
7,237
Broad Channel
Q
QPL
1,317
667
510
571
Broadway
Q
QPL
6,515
16,063
15,017
15,829
Bronx Library Center
Bx
NYPL
18,547
40,199
57,323
65,859
Brooklyn Heights
B
BPL
24,381
5,624
13,335
21,293
Brower Park
B
BPL
8,172
5,839
6,240
3,216
Brownsville
B
BPL
15,704
4,162
2,754
3,272
Bushwick
B
BPL
5,135
9,269
5,249
7,502
Cambria Heights
Q
QPL
10,301
18,181
17,992
14,337
Canarsie
B
BPL
10,046
8,452
4,636
4,497
Carroll Gardens
B
BPL
4,018
11,420
9,093
12,666
Castle Hill
Bx
NYPL
1,785
4,142
4,987
6,431
Chatham Square
M
NYPL
18,334
15,278
17,024
21,957
City Island
Bx
NYPL
1,731
5,312
3,680
5,022
Clarendon
B
BPL
4,570
13,689
8,250
7,333
Clason's Point
Bx
NYPL
4,083
25,057
27,791
35,951
Clinton Hill
B
BPL
2,808
10,280
9,219
5,578
Columbus
M
NYPL
8,427
8,103
7,893
15,224
Coney Island
B
BPL
4,201
16,947
4,333
8,080
Corona
Q
QPL
11,497
33,706
20,701
30,153
Cortelyou
B
BPL
1,486
6,626
13,940
11,642
Countee Cullen
M
NYPL
8,768
12,706
12,833
13,225
Court Square
Q
QPL
385
1,653
4,025
4,540
Crown Heights
B
BPL
3,362
10,615
10,430
16,421
Cypress Hills
B
BPL
5,681
9,903
12,943
12,786
Dekalb
B
BPL
13,270
6,413
5,836
5,144
Dongan Hills
SI
NYPL
6,883
14,569
7,094
8,384
Douglaston
Q
QPL
3,608
4,611
3,345
4,048
Dyker
B
BPL
10,147
14,165
10,684
12,748
East Elmhurst
Q
QPL
12,415
11,923
9,321
12,109
East Flatbush
B
BPL
7,144
7,126
5,037
4,233
East Flushing
Q
QPL
3,686
5,522
4,709
3,009
Eastchester
Bx
NYPL
2,545
9,791
8,434
6,947
Eastern Parkway
B
BPL
3,558
11,981
7,221
11,769
Edenwald
Bx
NYPL
954
7,125
11,991
15,553
Elmhurst
Q
QPL
12,845
7,224
234
2,420
Epiphany
M
NYPL
4,808
7,344
11,442
10,470
Far Rockaway
Q
QPL
7,451
7,129
10,433
11,106
Flatbush
B
BPL
9,443
9,654
9,096
18,395
Flatlands
B
BPL
12,541
10,302
5,547
5,160
Flushing
Q
QPL
42,715
58,117
60,991
58,923
Forest Hills
Q
QPL
9,581
32,361
16,511
21,458
Fort Hamilton
B
BPL
6,146
10,510
7,926
6,562
Fort Washington
M
NYPL
9,089
15,743
15,763
13,342
Francis Martin
Bx
NYPL
9,527
9,215
6,777
8,293
Fresh Meadows
Q
QPL
8,162
13,184
12,582
8,015
George Bruce
M
NYPL
4,025
14,653
15,262
12,059
Gerritsen Beach
B
BPL
8,376
13,678
5,705
7,721
Glen Oaks
Q
QPL
4,870
2,204
1,514
14,089
Glendale
Q
QPL
4,100
2,183
1,744
2,219
Grand Central
M
NYPL
4,368
7,181
6,188
Grand Concourse
Bx
NYPL
422
16,305
14,536
13,314
Gravesend
B
BPL
8,129
8,221
2,777
4,406
Great Kills
SI
NYPL
9,638
9,218
9,102
11,618
Greenpoint
B
BPL
5,337
11,527
5,185
11,879
Hamilton Fish Park
M
NYPL
5,805
9,795
7,673
7,460
Hamilton Grange
M
NYPL
1,657
10,193
11,200
20,964
Harlem
M
NYPL
2,442
12,586
15,151
17,650
High Bridge
Bx
NYPL
2,234
7,050
10,459
9,259
Highlawn
B
BPL
8,412
13,946
7,373
10,553
Hillcrest
Q
QPL
3,983
4,842
3,185
3,576
Hollis
Q
QPL
2,938
3,241
3,579
5,242
Homecrest
B
BPL
5,028
8,764
4,462
6,745
Howard Beach
Q
QPL
4,088
2,528
3,290
4,151
Hudson Park
M
NYPL
2,690
14,065
15,173
7,526
Huguenot Park
SI
NYPL
5,385
10,818
10,577
9,801
Hunt's Point
Bx
NYPL
4,178
8,113
13,099
11,349
Inwood
M
NYPL
8,672
15,615
14,700
17,626
Jackson Heights
Q
QPL
21,288
23,333
20,659
21,357
Jamaica Bay
B
BPL
4,752
3,396
4,795
Jefferson Market
M
NYPL
9,632
20,575
18,836
21,458
Jerome Park
Bx
NYPL
1,201
5,097
3,950
6,162
Kensington
B
BPL
9,646
13,373
7,684
9,785
Kew Gardens Hills
Q
QPL
3,714
6,993
4,040
1,222
Kings Bay
B
BPL
35,688
17,759
17,640
20,184
Kings Highway
B
BPL
19,347
49,271
29,582
24,667
Kingsbridge
Bx
NYPL
5,464
12,903
12,149
14,144
Kips Bay
M
NYPL
8,070
11,907
15,432
19,147
Langston Hughes
Q
QPL
20,366
21,491
29,731
20,717
Laurelton
Q
QPL
17,947
7,044
8,497
14,648
Lefferts
Q
QPL
19,846
10,373
18,670
18,225
Lefrak City
Q
QPL
10,788
7,649
5,341
10,508
Leonard
B
BPL
11,096
26,436
26,912
26,878
Long Island City
Q
QPL
33,720
19,841
39,777
Macomb's Bridge
M
NYPL
669
4,572
4,773
5,116
Macon
B
BPL
10,789
11,322
7,649
13,225
Mapleton
B
BPL
7,314
14,419
11,623
8,693
Marcy
B
BPL
9,736
7,120
3,431
4,760
Mariners Harbor
SI
NYPL
6,521
Maspeth
Q
QPL
4,945
5,248
4,368
3,993
McGoldrick
Q
QPL
6,587
9,732
8,442
13,458
McKinley Park
B
BPL
9,338
15,567
4,590
7,855
Melrose
Bx
NYPL
7,080
14,013
13,785
11,184
Middle Village
Q
QPL
2,087
1,223
813
641
Mid-Manhattan Library
M
NYPL
8,423
43,898
45,646
45,202
Midwood
B
BPL
14,940
12,571
12,540
18,683
Mill Basin
B
BPL
6,089
5,909
5,547
8,455
Mitchell-Linden
Q
QPL
3,076
8,763
6,677
8,387
Morningside Heights (Columbia)
M
NYPL
5,553
15,242
21,800
19,651
Morris Park
Bx
NYPL
11,681
8,855
12,623
Morrisania
Bx
NYPL
5,961
18,893
19,735
18,185
Mosholu
Bx
NYPL
2,586
11,154
11,325
13,050
Mott Haven
Bx
NYPL
5,906
22,069
22,374
15,092
Muhlenberg
M
NYPL
3,190
14,424
14,042
17,826
Mulberry Street
M
NYPL
11,987
11,050
17,618
New Amsterdam
M
NYPL
1,752
2,005
6,469
13,456
New Dorp
SI
NYPL
6,932
14,839
17,195
18,336
New Lots
B
BPL
10,511
11,264
11,469
14,512
New Utrecht
B
BPL
14,007
19,498
10,775
20,771
No. Forest Park
Q
QPL
3,637
3,230
2,664
2,386
North Hills
Q
QPL
3,461
7,443
8,066
9,935
Ottendorfer
M
NYPL
2,088
16,806
13,109
13,091
Ozone Park
Q
QPL
2,382
6,278
9,295
7,043
Pacific
B
BPL
7,951
13,545
14,180
18,782
Paerdegat
B
BPL
1,995
7,096
5,839
5,747
Park Slope
B
BPL
8,382
23,666
37,030
12,658
Parkchester
Bx
NYPL
9,631
29,843
25,434
27,602
Pelham Bay
Bx
NYPL
3,036
9,590
12,930
14,651
Peninsula
Q
QPL
4,116
16,348
5,491
1,758
Pomonok
Q
QPL
5,796
11,824
10,019
9,515
Poppenhusen
Q
QPL
3,002
4,818
4,466
5,833
Port Richmond
SI
NYPL
7,152
10,530
6,301
5,075
Queens Central
Q
QPL
16,057
41,723
55,153
61,948
Queens Village
Q
QPL
7,828
16,658
18,274
16,905
Queensboro Hill
Q
QPL
3,258
5,830
1,402
Red Hook
B
BPL
7,749
9,840
4,410
8,568
Rego Park
Q
QPL
5,474
6,178
4,824
4,889
Richmond Hill
Q
QPL
15,399
7,339
8,114
25,684
Richmondtown
SI
NYPL
7,181
11,441
6,854
5,830
Ridgewood
Q
QPL
5,539
26,383
34,166
42,486
Riverdale
Bx
NYPL
1,207
6,335
10,713
10,889
Riverside
M
NYPL
5,578
16,578
35,197
38,093
Rochdale Village
Q
QPL
4,543
2,927
8,412
6,732
Roosevelt Island
M
NYPL
2,340
9,613
10,414
12,381
Rosedale
Q
QPL
11,524
6,326
6,426
6,915
Rugby
B
BPL
5,894
8,610
5,732
7,927
Ryder
B
BPL
14,108
6,629
3,195
5,532
Saratoga
B
BPL
9,056
5,848
4,105
5,403
Seaside
Q
QPL
4,169
1,579
4,156
9,883
Sedgwick
Bx
NYPL
480
6,801
6,851
7,543
Seward Park
M
NYPL
10,711
37,695
32,681
38,807
Sheepshead Bay
B
BPL
9,377
17,146
14,277
34,196
Soundview
Bx
NYPL
7,317
21,413
15,673
9,222
South Beach
SI
NYPL
2,546
10,465
10,708
12,986
South Hollis
Q
QPL
7,038
1,341
1,860
6,048
South Jamaica
Q
QPL
7,238
6,421
11,512
10,272
South Ozone Park
Q
QPL
6,158
12,869
10,377
5,370
Spring Creek
B
BPL
3,511
12,822
9,471
5,055
Spuyten Duyvil
Bx
NYPL
1,669
5,267
4,578
5,550
St. Agnes
M
NYPL
7,531
22,243
29,844
21,677
St. Albans
Q
QPL
4,331
4,338
2,760
3,533
St. George Library
SI
NYPL
8,459
12,892
20,236
22,974
Stapleton
SI
NYPL
3,178
1,544
15,662
Steinway
Q
QPL
6,658
17,103
24,657
34,637
Stone Avenue
B
BPL
12,274
9,784
8,200
4,633
Sunnyside
Q
QPL
9,706
10,738
10,470
16,187
Sunset Park
B
BPL
11,281
10,105
10,986
14,610
Terence Cardinal Cooke
M
NYPL
49
955
615
424
Throg's Neck
Bx
NYPL
976
8,459
10,233
9,863
Todt Hill-Westerleigh
SI
NYPL
7,523
6,779
6,850
7,372
Tompkins Square
M
NYPL
5,406
9,345
8,723
12,688
Tottenville
SI
NYPL
4,577
7,440
7,069
9,469
Tremont
Bx
NYPL
3,022
13,473
12,625
15,452
Ulmer Park
B
BPL
11,103
10,095
7,082
6,591
Van Cortlandt
Bx
NYPL
1,336
3,238
2,109
3,147
Van Nest
Bx
NYPL
5,901
6,901
8,408
11,950
Wakefield
Bx
NYPL
3,647
10,852
14,317
10,089
Walt Whitman
B
BPL
7,902
5,067
3,204
3,015
Washington Heights
M
NYPL
6,531
83
4,168
Washington Irving
B
BPL
10,710
2,762
2,643
4,343
Webster
M
NYPL
11,197
13,374
11,691
West Farms
Bx
NYPL
10,857
11,976
15,797
11,717
West New Brighton
SI
NYPL
4,407
5,351
3,952
3,807
Westchester Square
Bx
NYPL
1,027
14,910
11,883
18,532
Whitestone
Q
QPL
3,487
3,794
3,343
3,904
Williamsburgh
B
BPL
11,393
6,326
12,211
5,211
Windsor Park
Q
QPL
6,583
7,303
7,405
7,193
Windsor Terrace
B
BPL
10,921
25,171
15,524
16,522
Woodhaven
Q
QPL
5,573
10,083
8,259
10,976
Woodlawn Heights
Bx
NYPL
1,194
1,795
1,580
1,834
Woodside
Q
QPL
9,206
18,231
18,370
22,028
Woodstock
Bx
NYPL
1,979
5,508
6,754
9,345
Yorkville
M
NYPL
9,060
9,710
8,754
3,499
XI. Branch by Branch Visitors
Branch Name
Borough
System
FY2013
FY 2014
115th Street
M
NYPL
111,124
115,987
125th Street
M
NYPL
107,840
31,876
58th Street
M
NYPL
240,223
225,259
67th Street
M
NYPL
178,261
161,834
96th Street
M
NYPL
107,310
141,297
Aguilar
M
NYPL
183,086
178,700
Allerton
Bx
NYPL
97,748
82,229
Andrew Heiskell
M
NYPL
79,364
82,464
Arlington
B
BPL
57,936
65,737
Arverne
Q
QPL
42,150
32,069
Astoria
Q
QPL
102,759
93,103
Auburndale
Q
QPL
88,805
78,473
Baisley Park
Q
QPL
92,336
69,033
Battery Park City
M
NYPL
169,222
169,012
Bay Ridge
B
BPL
207,116
189,689
Bay Terrace
Q
QPL
133,729
103,805
Baychester
Bx
NYPL
183,398
169,829
Bayside
Q
QPL
108,313
207,105
Bedford
B
BPL
74,354
109,887
Bellerose
Q
QPL
120,986
34,235
Belmont
Bx
NYPL
205,057
192,307
Bloomingdale
M
NYPL
216,897
205,212
Borough Park
B
BPL
170,560
125,101
Brooklyn Central
B
BPL
1,434,524
1,194,494
Briarwood
Q
QPL
131,672
125,970
Brighton Beach
B
BPL
190,397
176,213
Broad Channel
Q
QPL
8,940
15,263
Broadway
Q
QPL
313,923
294,241
Bronx Library Center
Bx
NYPL
659,568
718,085
Brooklyn Heights
B
BPL
195,250
278,315
Brower Park
B
BPL
89,440
79,367
Brownsville
B
BPL
58,562
71,394
Bushwick
B
BPL
4,998
85,889
Cambria Heights
Q
QPL
190,491
200,226
Canarsie
B
BPL
144,248
120,332
Carroll Gardens
B
BPL
69,120
84,831
Castle Hill
Bx
NYPL
83,621
78,945
Chatham Square
M
NYPL
283,647
300,877
City Island
Bx
NYPL
43,863
41,250
Clarendon
B
BPL
81,310
88,371
Clason's Point
Bx
NYPL
173,920
169,781
Clinton Hill
B
BPL
87,006
70,800
Columbus
M
NYPL
102,290
124,510
Coney Island
B
BPL
78,545
64,435
Corona
Q
QPL
266,211
240,466
Cortelyou
B
BPL
273,884
217,463
Countee Cullen
M
NYPL
193,098
191,778
Court Square
Q
QPL
86,405
62,482
Crown Heights
B
BPL
160,512
164,144
Cypress Hills
B
BPL
106,737
98,368
Dekalb
B
BPL
125,424
105,861
Dongan Hills
SI
NYPL
70,141
67,681
Douglaston
Q
QPL
105,149
87,686
Dyker
B
BPL
119,236
97,827
East Elmhurst
Q
QPL
71,229
66,595
East Flatbush
B
BPL
71,581
100,789
East Flushing
Q
QPL
78,735
69,713
Eastchester
Bx
NYPL
107,855
110,173
Eastern Parkway
B
BPL
141,888
138,352
Edenwald
Bx
NYPL
99,664
110,482
Elmhurst
Q
QPL
221,645
192,757
Epiphany
M
NYPL
216,566
134,828
Far Rockaway
Q
QPL
212,588
184,711
Flatbush
B
BPL
161,262
139,450
Flatlands
B
BPL
81,450
88,367
Flushing
Q
QPL
1,647,575
1,727,541
Forest Hills
Q
QPL
357,202
335,443
Fort Hamilton
B
BPL
124,124
125,047
Fort Washington
M
NYPL
168,634
156,042
Francis Martin
Bx
NYPL
83,474
78,748
Fresh Meadows
Q
QPL
232,329
185,922
George Bruce
M
NYPL
109,023
90,354
Gerritsen Beach
B
BPL
32,177
37,824
Glen Oaks
Q
QPL
102,420
176,695
Glendale
Q
QPL
74,978
60,790
Grand Central
M
NYPL
181,376
183,390
Grand Concourse
Bx
NYPL
154,729
138,861
Gravesend
B
BPL
78,078
93,400
Great Kills
SI
NYPL
65,420
60,625
Greenpoint
B
BPL
169,152
161,370
Hamilton Fish Park
M
NYPL
149,246
162,873
Hamilton Grange
M
NYPL
198,453
183,745
Harlem
M
NYPL
139,499
153,406
High Bridge
Bx
NYPL
154,348
162,980
Highlawn
B
BPL
195,988
148,262
Hillcrest
Q
QPL
127,732
130,215
Hollis
Q
QPL
108,423
94,008
Homecrest
B
BPL
73,500
71,839
Howard Beach
Q
QPL
94,553
102,022
Hudson Park
M
NYPL
119,795
57,102
Huguenot Park
SI
NYPL
74,512
67,920
Hunt's Point
Bx
NYPL
126,285
120,186
Inwood
M
NYPL
236,249
227,135
Jackson Heights
Q
QPL
479,940
445,970
Jamaica Bay
B
BPL
61,824
78,174
Jefferson Market
M
NYPL
250,112
287,007
Jerome Park
Bx
NYPL
96,552
100,688
Kensington
B
BPL
220,584
186,295
Kew Gardens Hills
Q
QPL
121,919
94,591
Kings Bay
B
BPL
839,904
184,905
Kings Highway
B
BPL
411,112
378,306
Kingsbridge
Bx
NYPL
207,803
193,138
Kips Bay
M
NYPL
155,228
164,911
Langston Hughes
Q
QPL
186,901
168,849
Laurelton
Q
QPL
137,255
128,504
Lefferts
Q
QPL
249,618
219,039
Lefrak City
Q
QPL
131,977
134,315
Leonard
B
BPL
98,700
102,156
Long Island City
Q
QPL
186,425
154,561
Macomb's Bridge
M
NYPL
39,294
37,897
Macon
B
BPL
145,236
128,127
Mapleton
B
BPL
90,864
128,641
Marcy
B
BPL
47,850
67,308
Mariners Harbor
SI
NYPL
40,713
Maspeth
Q
QPL
161,349
151,914
McGoldrick
Q
QPL
147,480
148,987
McKinley Park
B
BPL
375,284
284,592
Melrose
Bx
NYPL
168,640
164,742
Middle Village
Q
QPL
56,174
50,357
Mid-Manhattan Library
M
NYPL
1,592,669
1,306,240
Midwood
B
BPL
201,552
181,471
Mill Basin
B
BPL
109,824
99,618
Mitchell-Linden
Q
QPL
59,936
127,084
Morningside Heights (Columbia)
M
NYPL
267,250
254,470
Morris Park
Bx
NYPL
111,133
111,584
Morrisania
Bx
NYPL
138,775
148,229
Mosholu
Bx
NYPL
188,865
195,361
Mott Haven
Bx
NYPL
214,544
203,280
Muhlenberg
M
NYPL
196,697
190,238
Mulberry Street
M
NYPL
165,583
171,595
New Amsterdam
M
NYPL
243,495
243,047
New Dorp
SI
NYPL
137,329
129,460
New Lots
B
BPL
143,726
150,548
New Utrecht
B
BPL
244,848
238,219
No. Forest Park
Q
QPL
96,041
93,762
North Hills
Q
QPL
111,928
109,273
Ottendorfer
M
NYPL
124,502
138,452
Ozone Park
Q
QPL
110,661
80,237
Pacific
B
BPL
90,376
91,656
Paerdegat
B
BPL
78,884
68,835
Park Slope
B
BPL
70,274
160,788
Parkchester
Bx
NYPL
239,652
249,572
Pelham Bay
Bx
NYPL
106,747
100,553
Peninsula
Q
QPL
45,835
0
Pomonok
Q
QPL
115,415
97,163
Poppenhusen
Q
QPL
83,618
77,690
Port Richmond
SI
NYPL
100,221
83,949
Queens Central
Q
QPL
1,417,322
1,451,611
Queens Village
Q
QPL
122,330
110,104
Queensboro Hill
Q
QPL
35,178
Red Hook
B
BPL
36,155
59,897
Rego Park
Q
QPL
210,328
196,552
Richmond Hill
Q
QPL
131,037
167,964
Richmondtown
SI
NYPL
99,079
92,721
Ridgewood
Q
QPL
265,992
270,604
Riverdale
Bx
NYPL
89,157
93,982
Riverside
M
NYPL
287,799
281,223
Rochdale Village
Q
QPL
145,212
125,034
Roosevelt Island
M
NYPL
88,748
86,789
Rosedale
Q
QPL
113,969
95,724
Rugby
B
BPL
96,096
88,518
Ryder
B
BPL
147,680
114,502
Saratoga
B
BPL
96,397
107,180
Seaside
Q
QPL
29,891
61,726
Sedgwick
Bx
NYPL
88,558
89,255
Seward Park
M
NYPL
324,415
326,264
Sheepshead Bay
B
BPL
84,280
102,059
Soundview
Bx
NYPL
97,418
89,069
South Beach
SI
NYPL
55,499
58,801
South Hollis
Q
QPL
156,422
119,400
South Jamaica
Q
QPL
127,021
121,505
South Ozone Park
Q
QPL
96,900
85,622
Spring Creek
B
BPL
68,328
65,641
Spuyten Duyvil
Bx
NYPL
162,055
157,449
St. Agnes
M
NYPL
268,994
250,958
St. Albans
Q
QPL
96,658
97,817
St. George Library
SI
NYPL
212,230
214,281
Stapleton
SI
NYPL
128,767
Steinway
Q
QPL
247,512
231,405
Stone Avenue
B
BPL
73,112
54,249
Sunnyside
Q
QPL
263,163
228,325
Sunset Park
B
BPL
266,448
215,758
Terence Cardinal Cooke
M
NYPL
75,226
37,598
Throg's Neck
Bx
NYPL
93,125
93,366
Todt Hill-Westerleigh
SI
NYPL
207,977
193,236
Tompkins Square
M
NYPL
146,871
145,804
Tottenville
SI
NYPL
68,622
58,355
Tremont
Bx
NYPL
85,239
79,394
Ulmer Park
B
BPL
127,536
113,148
Van Cortlandt
Bx
NYPL
73,533
83,047
Van Nest
Bx
NYPL
127,343
132,826
Wakefield
Bx
NYPL
128,730
139,215
Walt Whitman
B
BPL
72,096
77,971
Washington Heights
M
NYPL
20,225
Washington Irving
B
BPL
74,688
74,242
Webster
M
NYPL
172,250
164,204
West Farms
Bx
NYPL
124,105
127,903
West New Brighton
SI
NYPL
78,937
66,515
Westchester Square
Bx
NYPL
90,130
87,521
Whitestone
Q
QPL
100,851
97,016
Williamsburgh
B
BPL
636,740
84,290
Windsor Park
Q
QPL
126,568
122,920
Windsor Terrace
B
BPL
198,016
217,865
Woodhaven
Q
QPL
98,838
105,753
Woodlawn Heights
Bx
NYPL
60,518
60,455
Woodside
Q
QPL
221,405
154,487
Woodstock
Bx
NYPL
76,603
76,677
Yorkville
M
NYPL
182,041
168,331
Note: All library performance data, including program attendance, circulation and visitor data, were provided by the New York Public Library, Brooklyn Public Library and Queens Library. Some branch numbers may have been affected by prolonged closings due to renovations or repairs. In the tables, blanks are not equivalent to zero but rather indicate that data was not applicable; in most cases this was because a branch did not exist or was closed for the entire fiscal year.
This data analysis was written by David Giles with research assistance by Jeanette Estima. Design by Ahmad Dowla.
This data analysis is part of a series of research briefs on New York City public libraries that was generously funded by the Charles H. Revson Foundation.
Cover photo by Ross Mantle.
General operating support for Center for an Urban Future has been provided by the Bernard F. and Alva B. Gimbel Foundation, Fund for the City of New York, the Lucius N. Littauer Foundation and the M&T Charitable Foundation.