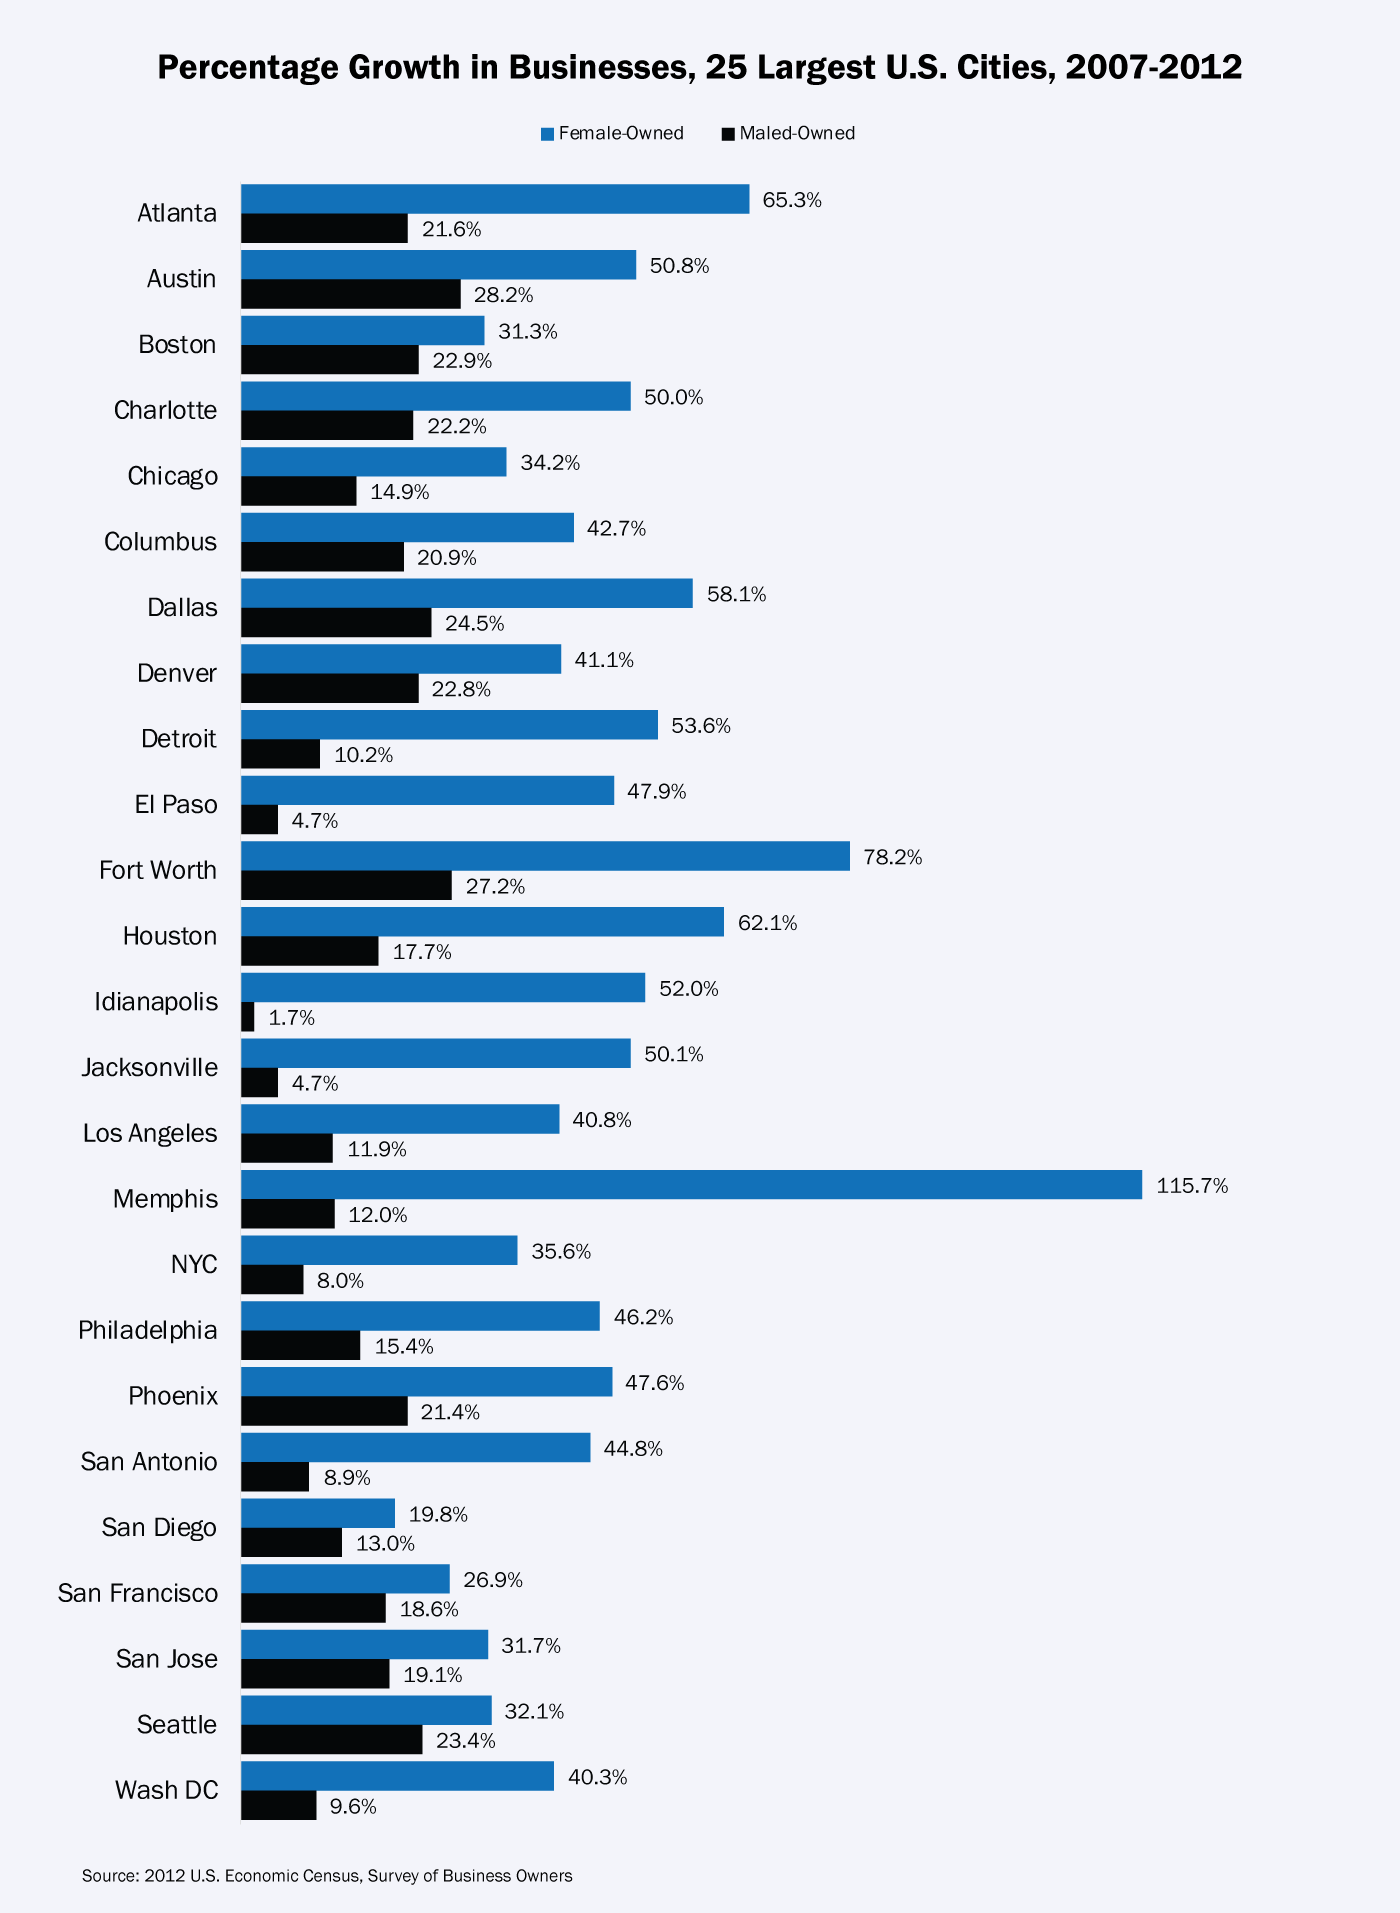
This data analysis provides a new level of data about the dramatic surge in women entrepreneurs in the nation’s 25 largest cities. The graphs below show that the growth of women-owned businesses in the 25 largest American cities between 2007 and 2012 far outpaced the overall growth in women-owned businesses nationally. And out of the 25 most populous cities in the U.S., only one had a slower growth rate in women-owned businesses than the nation.
Generously funded by Capital One’s Future Edge initiative, our analysis —provide data for each of the 25 largest U.S. cities, specifically the number of women-owned business, 5-year and 10-year growth rates for the number of women-owned businesses, revenues per women-owned business. Major findings include:
-
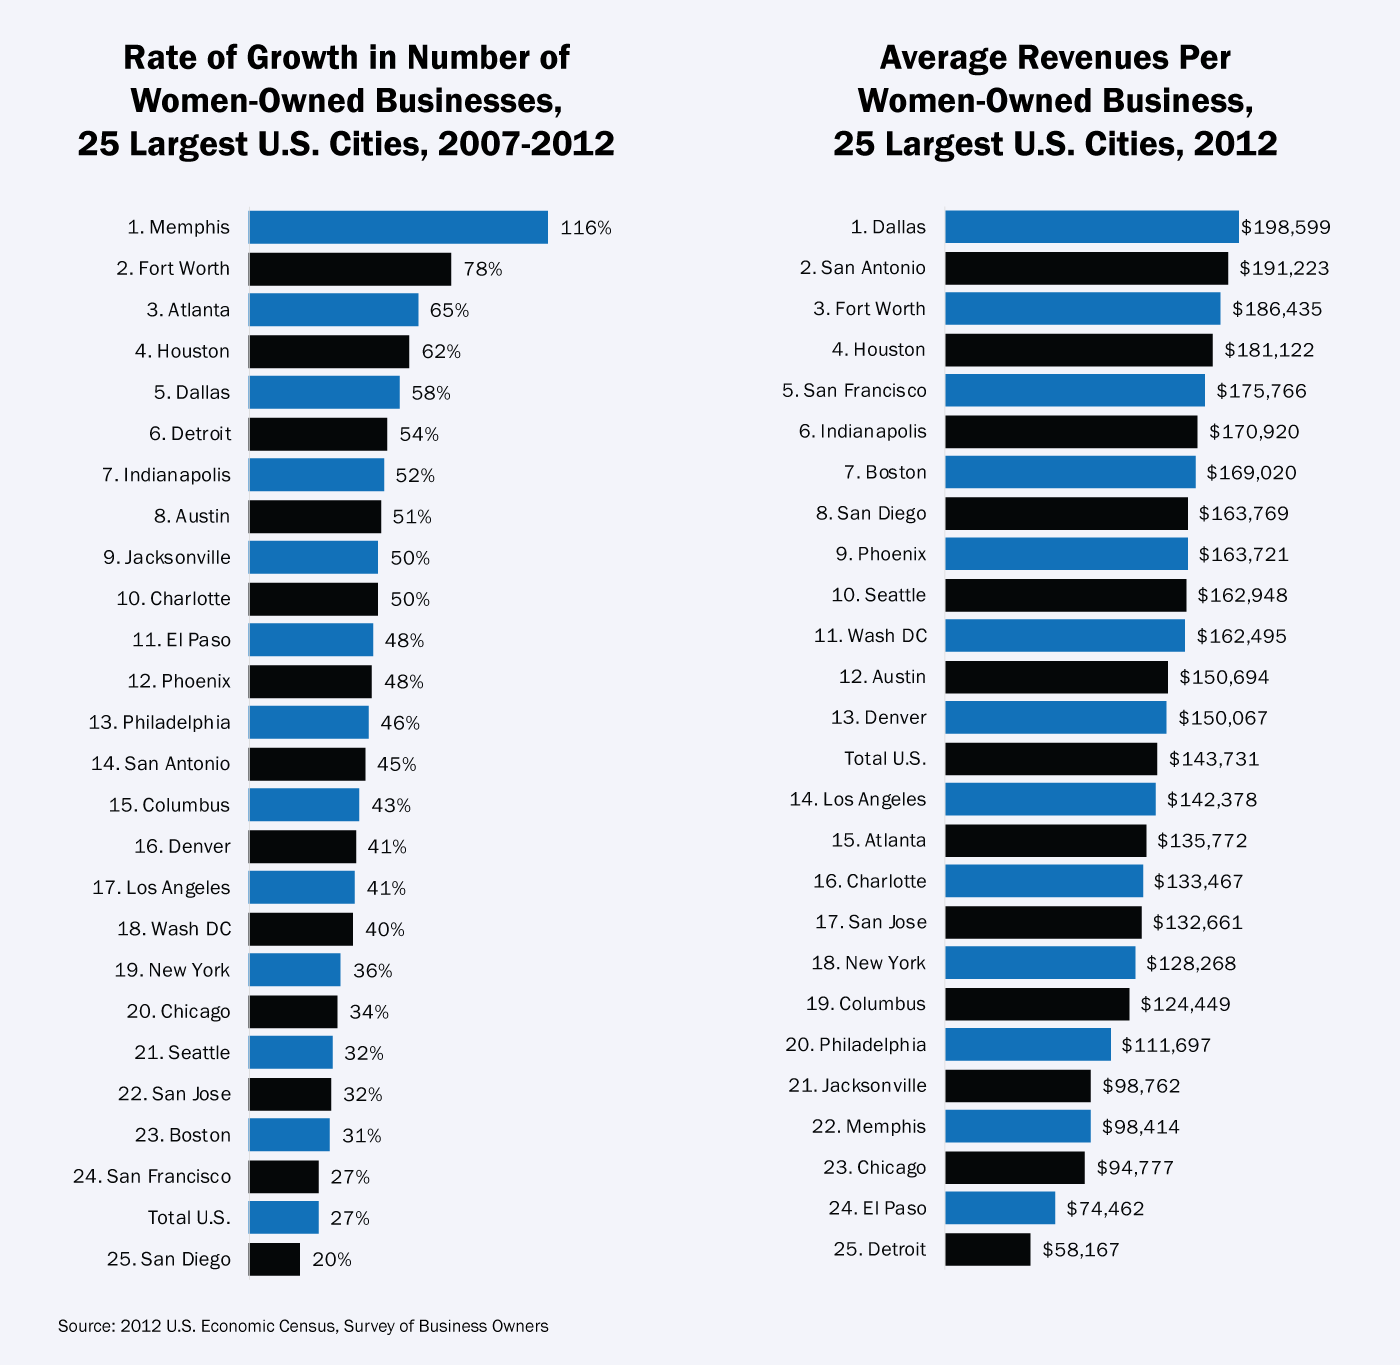
Of the nation’s 25 most populous cities, Memphis had the fastest growth in women-owned businesses between 2007 and 2012, the most recent year for which data from the U.S. Economic Census is available. The number of women-owned businesses in Memphis increased by 116 percent.
-
Fort Worth had the second highest five-year growth rate, with women-owned firms growing by 78 percent, followed by Atlanta (65 percent), Houston (62 percent) and Dallas (58 percent).
-
Of the 25 largest cities, Dallas ranks first in revenues per women-owned business, with $198,599 in average sales. San Antonio was second, with $191,223 in average sales, followed Fort Worth ($186,435), Houston ($181,122), and San Francisco ($175,766).
-
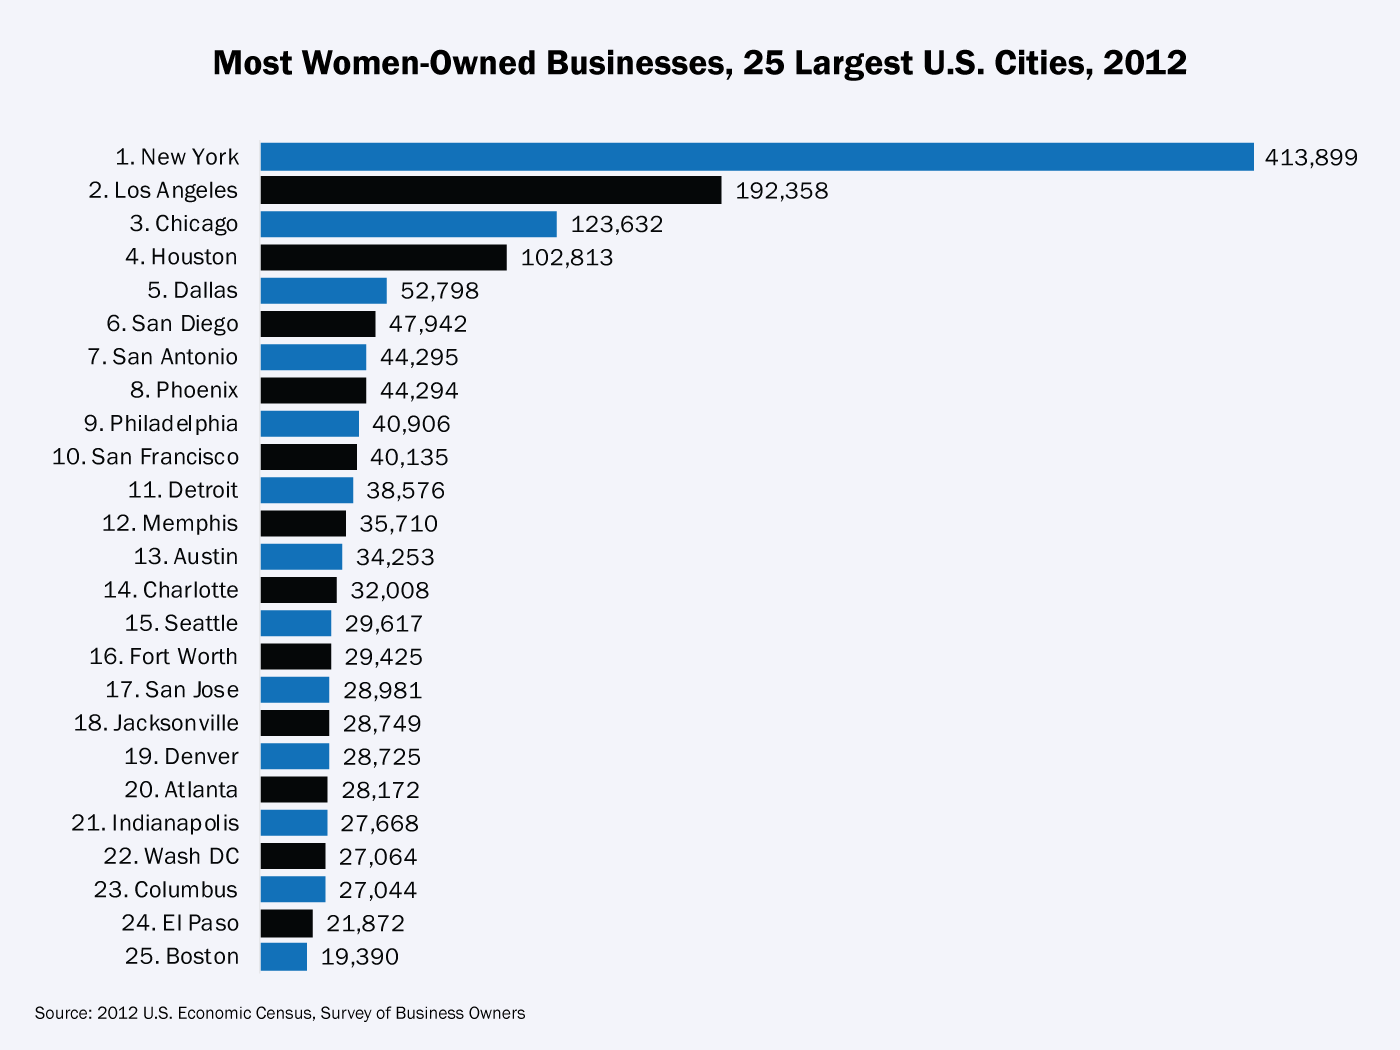
In terms of the overall numbers of women-owned businesses, New York City tops the list, with 413,899—more than double than the second-ranked city, Los Angeles (192,358). Chicago ranks third with 123,632 women owned firms, followed by Houston with 102,813 and Dallas with 52,798.
-
Over the last decade, from 2002-2012, the number of women-owned businesses in the United States increase by 52 percent. This amounts to 928 new businesses every day, adding over 1,290,245 jobs and $90,191,545 billion in payroll to the nation’s economy.
-
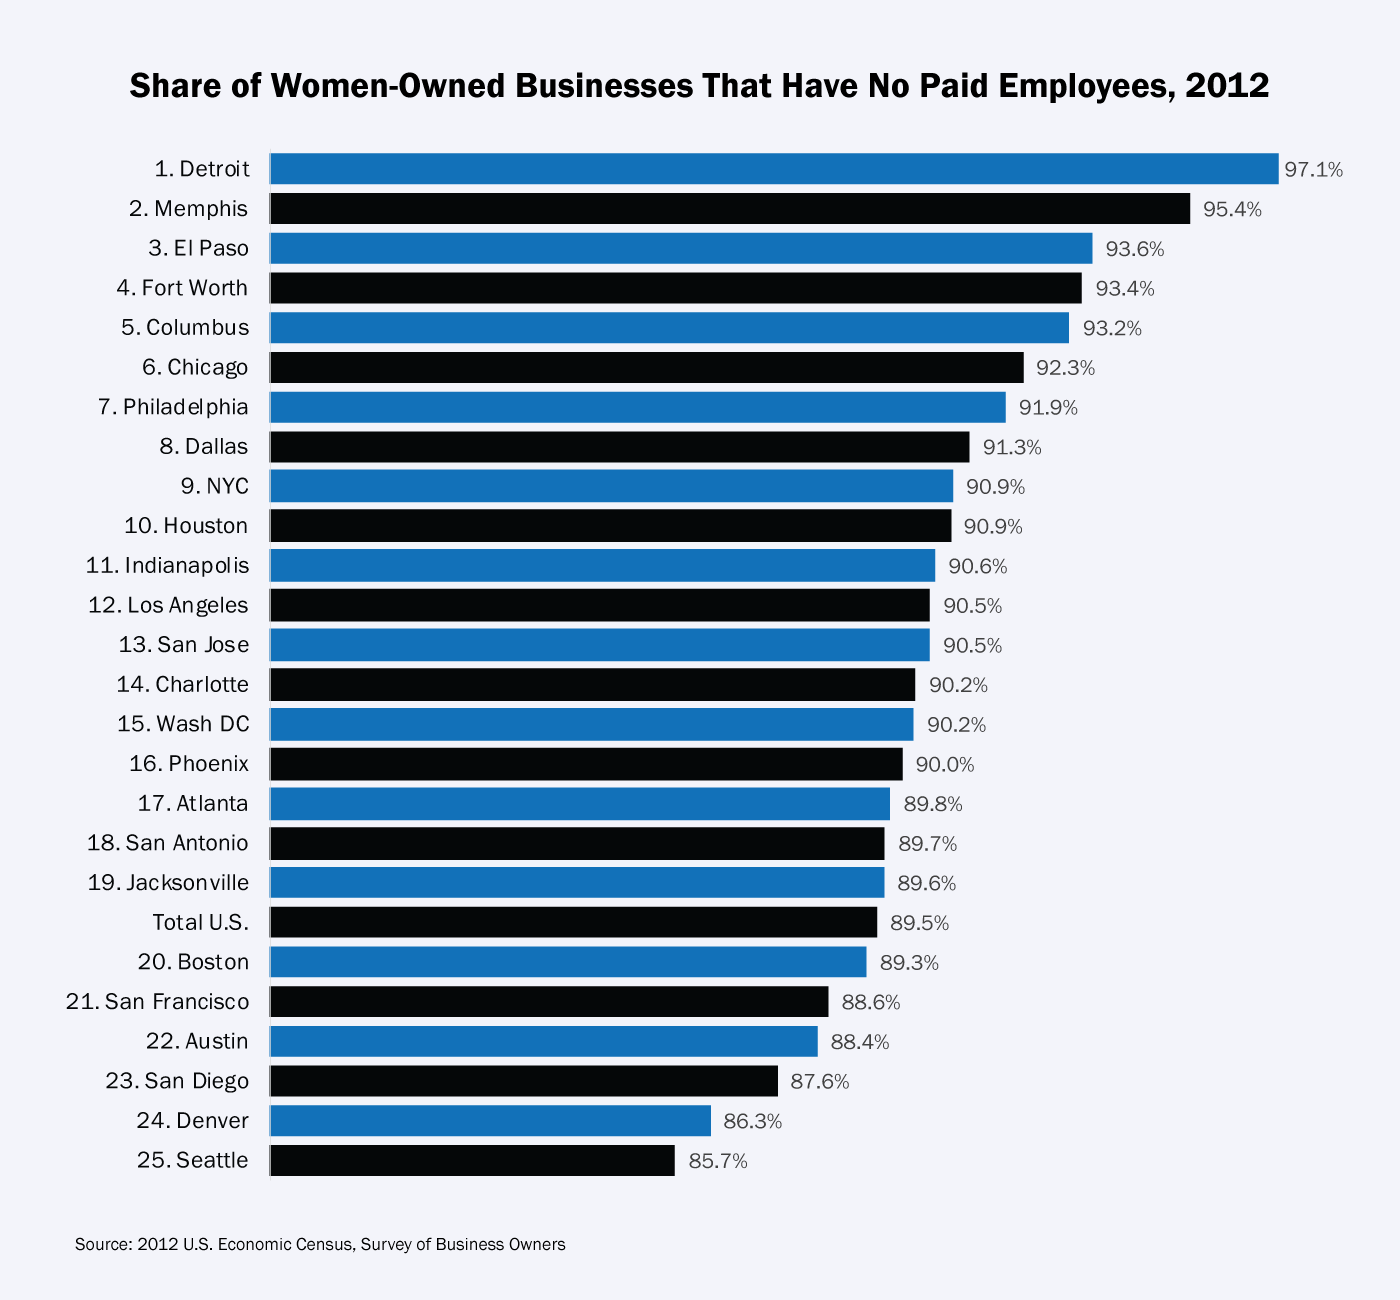
Ninety percent of all women-owned businesses in the U.S. have no paid employees.
-
If only one quarter of the existing 8,842,742 women-owned businesses in the United States with no employees added a single employee in the next three years, it would result in more than 2.2 million new jobs.
-
The cities with the slowest growth in women-owned businesses over the past five years include San Diego (which experienced a 20 percent increase in the number of women-owned businesses), San Francisco (27 percent increase), Boston (31 percent), San Jose (32 percent) and Seattle (32 percent).
This national data analysis accompanies “Breaking Through: Harnessing the Economic Potential of Women Entrepreneurs,” a 64-page report that focuses largely on the growing economic importance of women entrepreneurs in New York City, but also includes detailed chapters on the role of women entrepreneurs in four other cities: Atlanta, Dallas, Washington D.C. and San Francisco. Click here to read the full report, and see below for more data on women entrepreneurs nationally.
|
City |
2012 |
2007 |
Difference |
Percent Change |
|---|
|
NYC |
Female-Owned |
413899 |
305198 |
108701 |
35.6% |
|
Maled-Owned |
571852 |
529631 |
42221 |
8.0% |
|
ATLANTA |
Female-Owned |
28172 |
17047 |
11125 |
65.3% |
|
Maled-Owned |
31542 |
25949 |
5593 |
21.6% |
|
WASH DC |
Female-Owned |
27064 |
19291 |
7773 |
40.3% |
|
Maled-Owned |
30237 |
27588 |
2649 |
9.6% |
|
SAN FRAN |
Female-Owned |
40135 |
31639 |
8496 |
26.9% |
|
Maled-Owned |
63864 |
53836 |
10028 |
18.6% |
|
DALLAS |
Female-Owned |
52798 |
33387 |
19411 |
58.1% |
|
Maled-Owned |
76671 |
61581 |
15090 |
24.5% |
|
LOS ANGELES |
Female-Owned |
192358 |
136579 |
55779 |
40.8% |
|
Maled-Owned |
262460 |
234486 |
27974 |
11.9% |
|
CHICAGO |
Female-Owned |
123632 |
92119 |
31513 |
34.2% |
|
Maled-Owned |
147997 |
128852 |
19145 |
14.9% |
|
HOUSTON |
Female-Owned |
102813 |
63416 |
39397 |
62.1% |
|
Maled-Owned |
134236 |
114030 |
20206 |
17.7% |
|
SAN DIEGO |
Female-Owned |
47942 |
40020 |
7922 |
19.8% |
|
Maled-Owned |
72727 |
64360 |
8367 |
13.0% |
|
PHOENIX |
Female-Owned |
44294 |
30006 |
14288 |
47.6% |
|
Maled-Owned |
63479 |
52309 |
11170 |
21.4% |
|
PHILADELPHIA |
Female-Owned |
40906 |
27983 |
12923 |
46.2% |
|
Maled-Owned |
55745 |
48304 |
7441 |
15.4% |
|
DETROIT |
Female-Owned |
38576 |
25120 |
13456 |
53.6% |
|
Maled-Owned |
21089 |
19134 |
1955 |
10.2% |
|
MEMPHIS |
Female-Owned |
35710 |
16556 |
19154 |
115.7% |
|
Maled-Owned |
30568 |
27286 |
3282 |
12.0% |
|
AUSTIN |
Female-Owned |
34253 |
22714 |
11539 |
50.8% |
|
Maled-Owned |
51518 |
40184 |
11334 |
28.2% |
|
CHARLOTTE |
Female-Owned |
32008 |
21332 |
10676 |
50.0% |
|
Maled-Owned |
41600 |
34039 |
7561 |
22.2% |
|
SEATTLE |
Female-Owned |
29617 |
22412 |
7205 |
32.1% |
|
Maled-Owned |
42430 |
34397 |
8033 |
23.4% |
|
FORD WORTH |
Female-Owned |
29425 |
16515 |
12910 |
78.2% |
|
Maled-Owned |
35116 |
27615 |
7501 |
27.2% |
|
SAN JOSE |
Female-Owned |
28981 |
22000 |
6981 |
31.7% |
|
Maled-Owned |
40604 |
34095 |
6509 |
19.1% |
|
JACKSONVILLE |
Female-Owned |
28749 |
19155 |
9594 |
50.1% |
|
Maled-Owned |
33828 |
32309 |
1519 |
4.7% |
|
DENVER |
Female-Owned |
28725 |
20354 |
8371 |
41.1% |
|
Maled-Owned |
41776 |
34030 |
7746 |
22.8% |
|
INDIANAPOLIS |
Female-Owned |
27668 |
18202 |
9466 |
52.0% |
|
Maled-Owned |
34325 |
33758 |
567 |
1.7% |
|
COLUMBUS |
Female-Owned |
27044 |
18952 |
8092 |
42.7% |
|
Maled-Owned |
35593 |
29437 |
6156 |
20.9% |
|
EL PASO |
Female-Owned |
21872 |
14792 |
7080 |
47.9% |
|
Maled-Owned |
29356 |
28047 |
1309 |
4.7% |
|
SAN ANTONIO |
Female-Owned |
44295 |
30581 |
13714 |
44.8% |
|
Maled-Owned |
63283 |
58132 |
5151 |
8.9% |
|
BOSTON |
Female-Owned |
19390 |
14764 |
4626 |
31.3% |
|
Maled-Owned |
33543 |
27292 |
6251 |
22.9% |