Earlier this month, Mayor de Blasio and City Council Speaker Mark-Viverito announced a new action plan to bolster New York City’s industrial and manufacturing sector. The plan is promising for several reasons. For one, it is a welcome attempt to support a sector which has long been a critical source of middle income jobs for New Yorkers, but which also faces a number of challenges. Additionally, the plan comes at an opportune moment: following a decade in which the city lost an average of 9,600 manufacturing jobs a year, the city’s manufacturing sector has stabilized and begun to grow again.
 As this analysis demonstrates, between 2011 and 2014 the sector experienced a net gain of nearly 1,000 jobs. Even more encouraging, five different manufacturing subsectors had employment growth during this period: food manufacturing, fabricated metal product manufacturing, furniture and related product manufacturing, non-metallic mineral product manufacturing, and plastics and rubber product manufacturing. In recent years, New York City actually has out-performed the rest of the state in manufacturing growth.
This data brief—the inaugural publication of the Center for an Urban Future’s Middle Class Jobs Project, a research initiative supported by Fisher Brothers that will include a series of reports detailing opportunities to create and preserve middle income jobs in New York—provides a detailed snapshot of the city’s manufacturing sector. It takes a close look at trends in the 13 manufacturing subsectors that have at least 1,000 jobs in the five boroughs, detailing which are growing the fastest, which pay the highest wages and which comprise a disproportionately large share of jobs statewide. Our major findings include:
-
Over the last 3 years, New York City has outpaced the state in manufacturing job creation. Between 2011 and 2014, the city registered a net gain of 880 manufacturing jobs (a 1.2 percent increase) while the state lost 6,615 manufacturing jobs (a 1.4 percent decline).
-
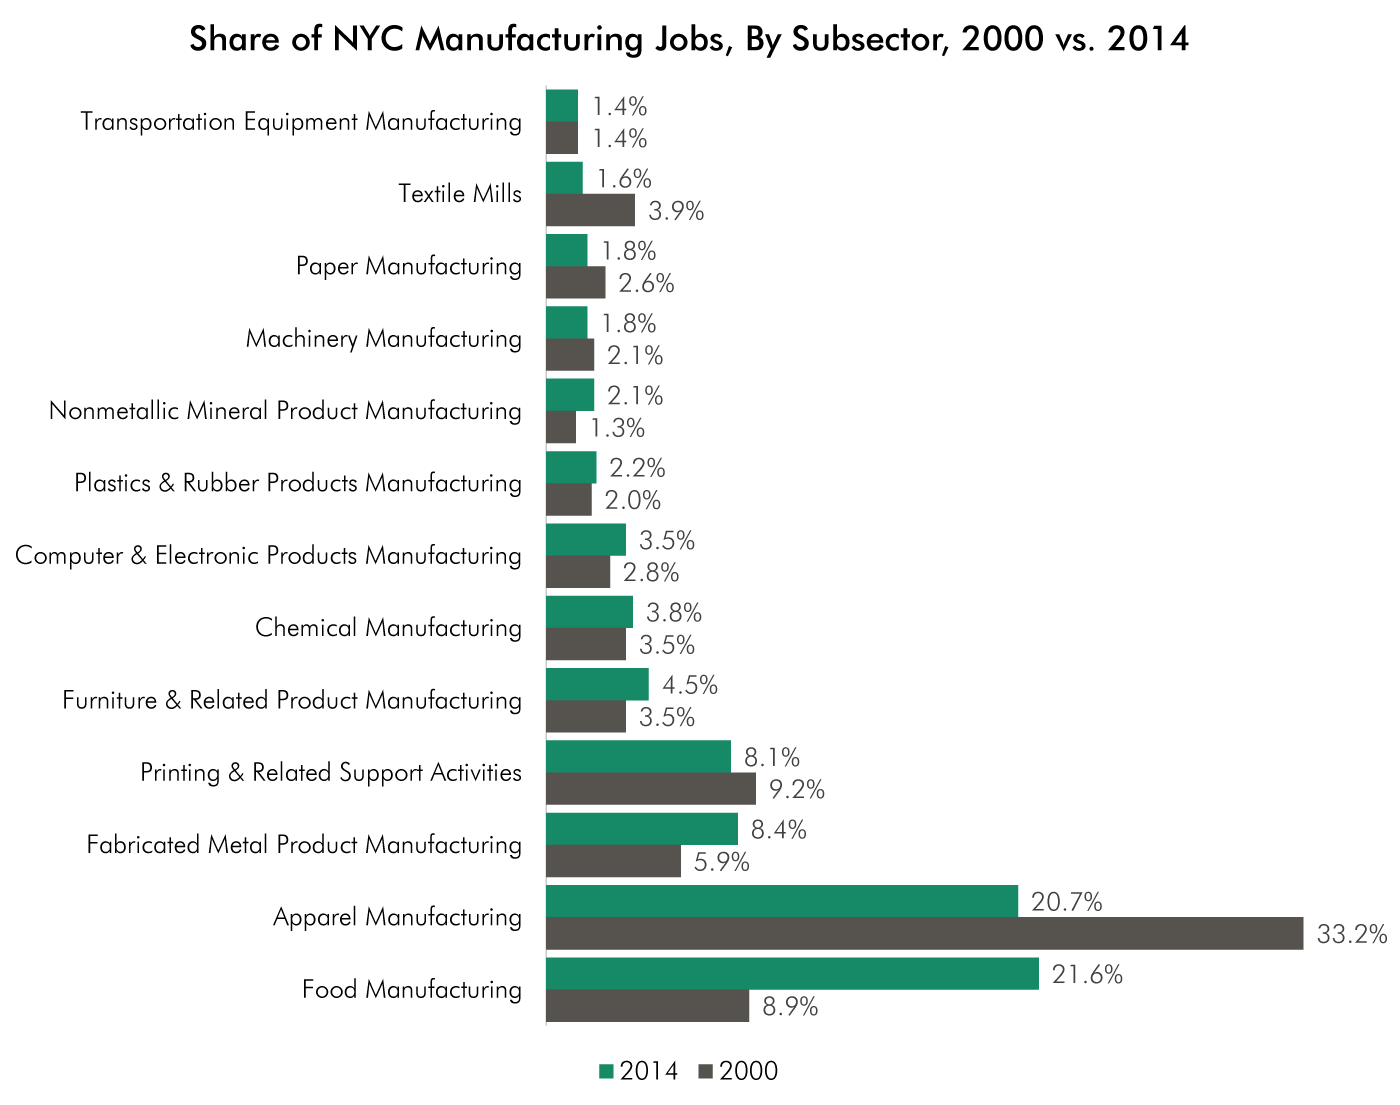
In 2014, food manufacturing became New York City’s largest manufacturing sector, with a total of 16,368 jobs. It surpassed apparel manufacturing, which for several generations had been the largest production sector. The number of apparel manufacturing jobs in the five boroughs has plunged from 57,178 in 2000 to 15,657 jobs in 2014.
-
In 2000, apparel manufacturing accounted for 33.2 percent of all manufacturing jobs in the city and food manufacturing accounted for 8.9 percent. In 2014, food accounted for 21.6 percent and apparel 20.7 percent.
-
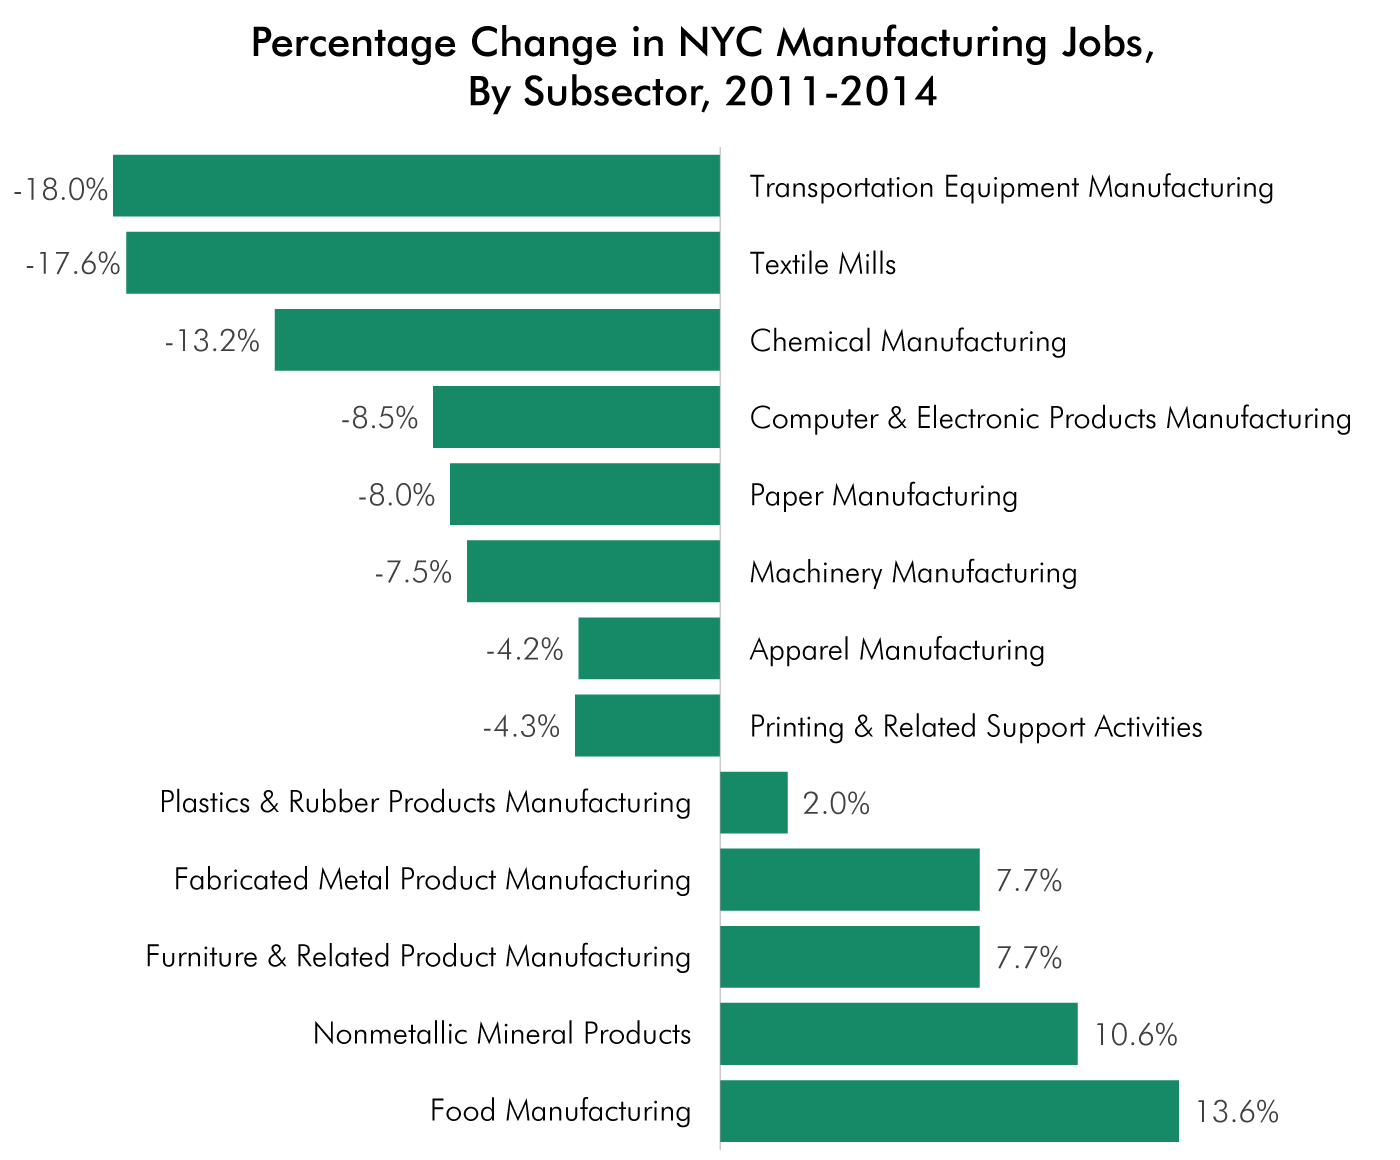
Between 2011 and 2014, five manufacturing sectors in the city experienced a net gain in jobs:
-
Food manufacturing +1,963 (a 13.6 % increase)
-
Fabricated Metal Product Manufacturing +451 (7.7 %)
-
Furniture & Related Product Manufacturing +244 (7.7 %)
-
Nonmetallic Mineral Product Manufacturing +153 (10.6 %)
-
Plastics & Rubber Product Manufacturing +33 (2.0 %)
-
Between 2011 and 2014, eight manufacturing sectors in the city experienced a net loss in jobs:
-
Apparel Manufacturing - 679 (-4.2 %)
-
Chemical Manufacturing - 436 (-13.2 %)
-
Printing & Related Support Activities - 274 (-4.3 %)
-
Textile Mills - 250 (-17.6 %)
-
Computer & Electronic Product Manufacturing - 246 (-8.5 %)
-
Transportation Equipment Manufacturing - 240 (-18.0 %)
-
Paper Manufacturing - 116 (-8.0 %)
-
Machinery Manufacturing - 110 (-7.5 %)
-
Only four manufacturing sectors have at least 5,000 jobs in New York City, down from seven in 2000. The sectors with the most manufacturing jobs in the five boroughs are:
-
Food Manufacturing 16,368
-
Apparel Manufacturing 15,657
-
Fabricated Metal Product Manufacturing 6,334
-
Printing & Related Support Activities 6,153
-
Furniture & Related Product Manufacturing 3,433
-
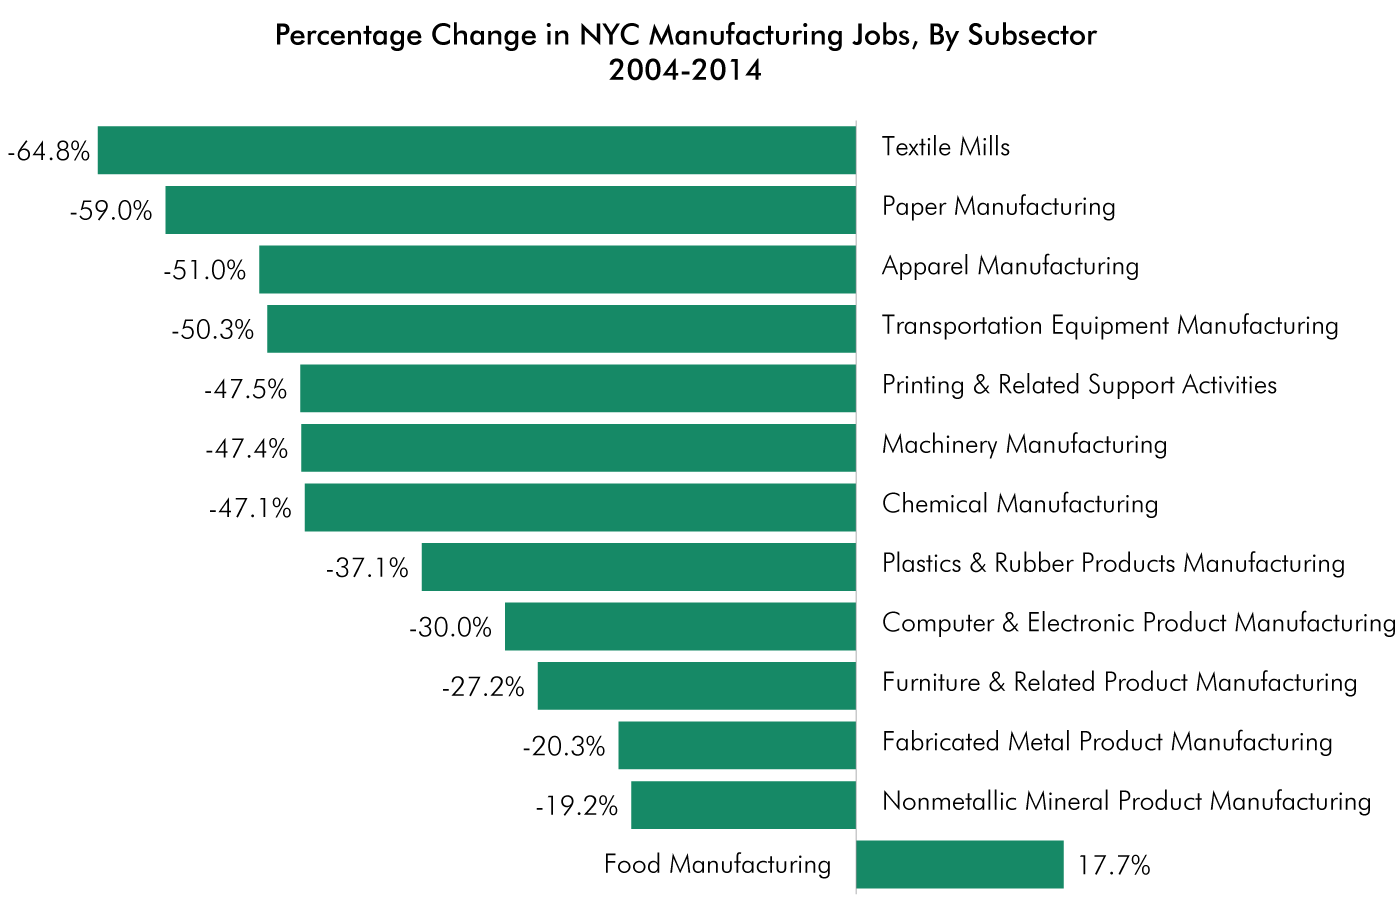
Over the last decade (2004 – 2014), food manufacturing was the only manufacturing sector with a net gain in employment. It experienced a 17.7 percent increase in jobs. Employment was down by at least 19 percent in every other manufacturing sector with at least 1,000 jobs in the five boroughs.
-
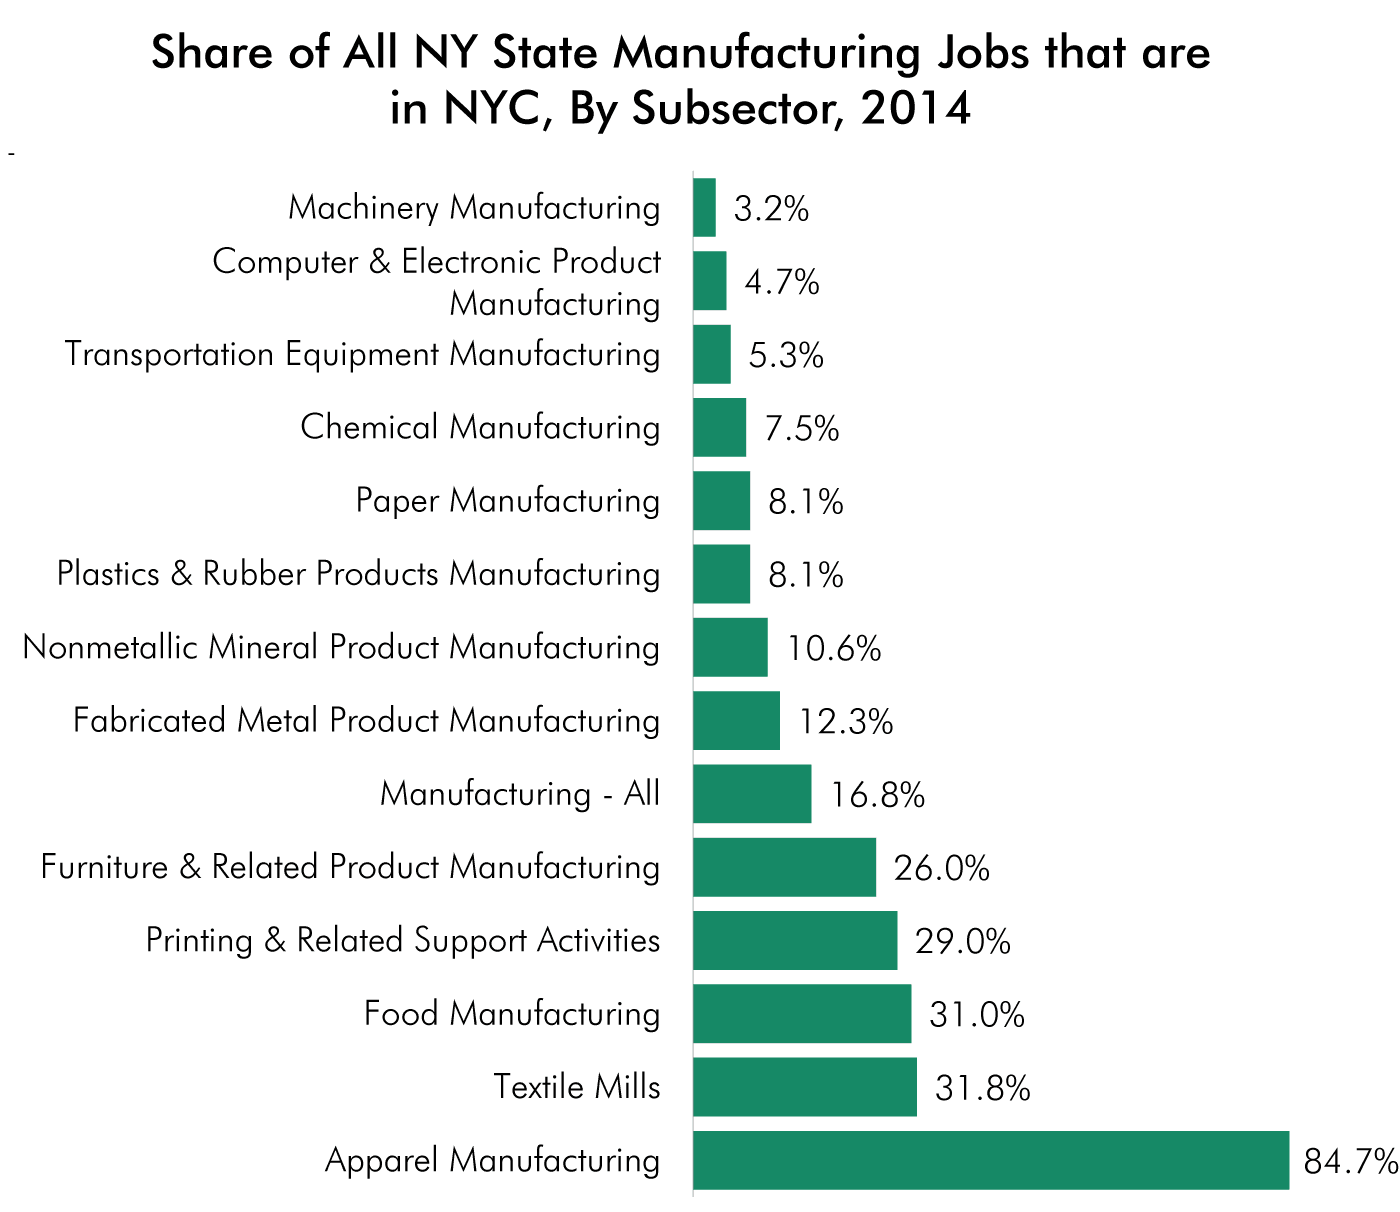
In five manufacturing sectors, New York City is home to at least a quarter of all jobs statewide. They are:
-
Apparel Manufacturing 84.7 % of the state’s jobs are in NYC
-
Textile Mills 31.8 %
-
Food Manufacturing 31.0 %
-
Printing & Related Support Activities 29.0 %
-
Furniture & Related Product Manufacturing 26.0 %
-
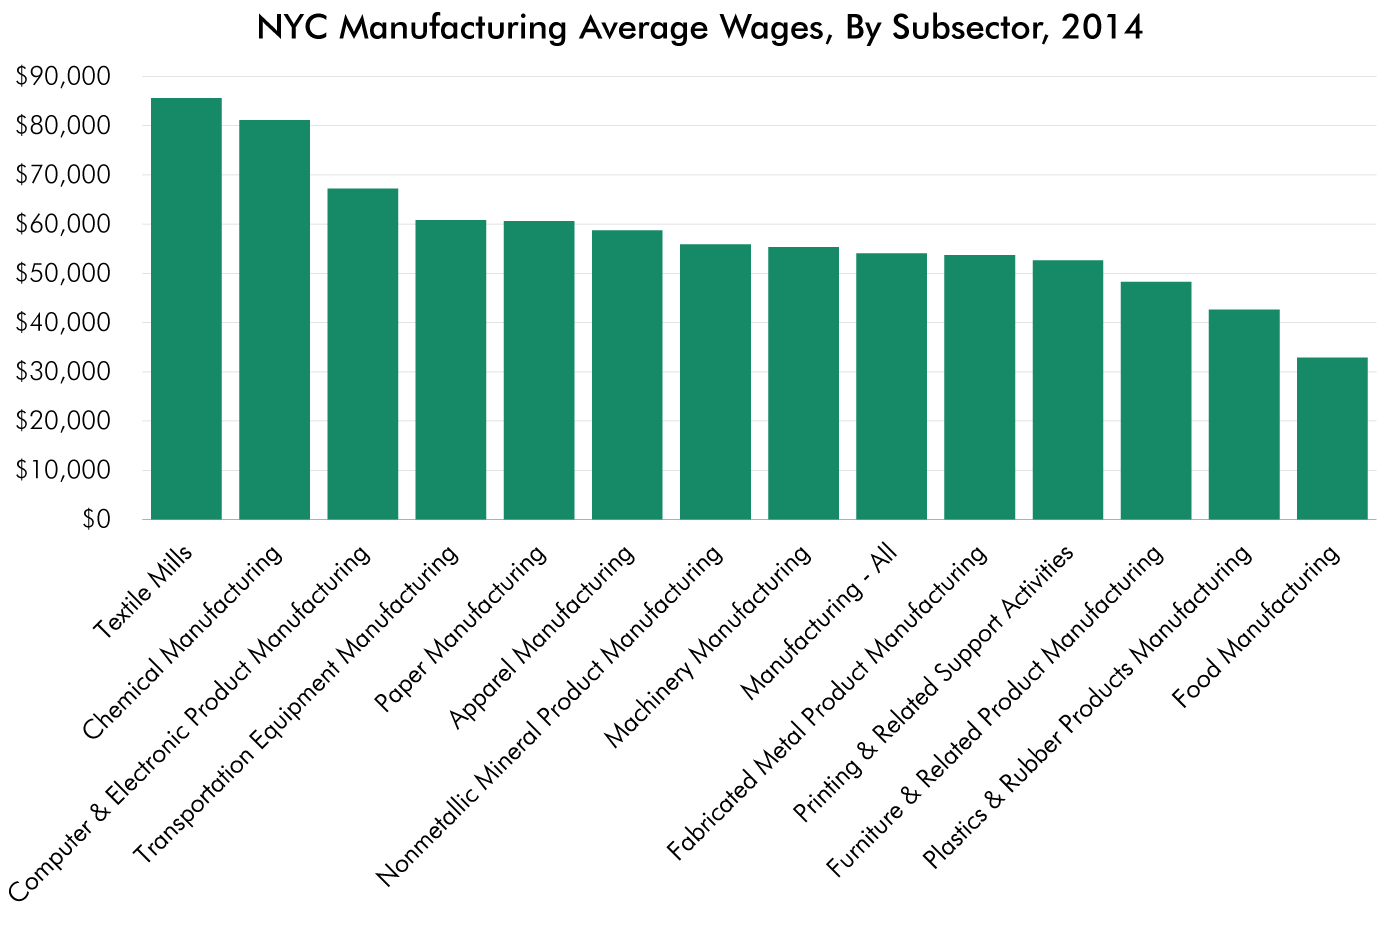
The fastest growing manufacturing sector, food manufacturing, is also the one that pays the lowest wages. The average annual wage in the city’s food manufacturing industry is $32,882, which is nearly 40 percent lower than average manufacturing wage in New York City ($54,028). Of the 13 leading manufacturing sectors that we examined for this report, food manufacturing is the only one with an annual wage under $42,000, and one of just three sectors with an average wage under $50,000.
-
The city’s six best-paying manufacturing sectors all experienced a net loss in jobs between 2011 and 2014.
-
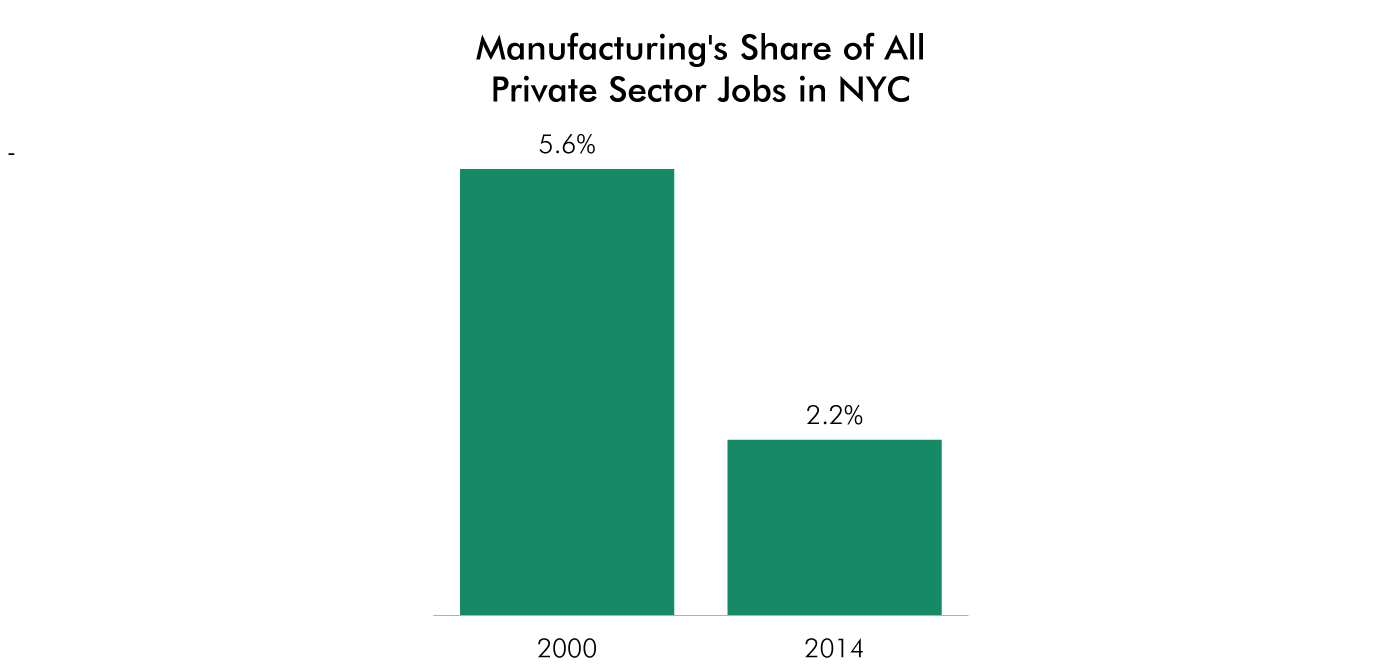
In 2014, the manufacturing industry accounted for just 2.2 percent of all private sector jobs in New York City, down from 5.6 percent in 2000.
.png)
.png)
.png)
.png)
.png)
|
New York City Manufacturing Employment, 2000 - 2014 |
|---|
|
|
2014 |
2013 |
2012 |
2011 |
2004 |
2000 |
|
Manufacturing - All |
75,654 |
75,860 |
75,940 |
74,774 |
119,787 |
172,266 |
|
Food Manufacturing |
16,368 |
15,471 |
15,400 |
14,405 |
13,901 |
15,365 |
|
Apparel Manufacturing |
15,657 |
16,118 |
16,415 |
16,336 |
31,980 |
57,178 |
|
Fabricated Metal Product Manufacturing |
6,334 |
6,313 |
6,263 |
5,883 |
7,944 |
10,145 |
|
Printing & Related Support Activities |
6,153 |
6,656 |
6,817 |
6,427 |
11,717 |
15,889 |
|
Furniture & Related Product Manufacturing |
3,433 |
3,265 |
3,078 |
3,189 |
4,717 |
5,966 |
|
Chemical Manufacturing |
2,859 |
2,926 |
3,333 |
3,295 |
5,403 |
6,044 |
|
Computer & Electronic Product Manufacturing |
2,647 |
2,973 |
2,796 |
2,893 |
3,779 |
4,794 |
|
Plastics & Rubber Products Manufacturing |
1,689 |
1,567 |
1,594 |
1,656 |
2,684 |
3,424 |
|
Nonmetallic Mineral Product Manufacturing |
1,599 |
1,664 |
1,548 |
1,446 |
1,979 |
2,274 |
|
Machinery Manufacturing |
1,365 |
1,373 |
1,307 |
1,475 |
2,596 |
3,539 |
|
Paper Manufacturing |
1,325 |
1,305 |
1,344 |
1,441 |
3,233 |
4,561 |
|
Textile Mills |
1,173 |
1,253 |
1,324 |
1,423 |
3,328 |
6,742 |
|
Transportation Equipment Manufacturing |
1,092 |
1,108 |
1,106 |
1,332 |
2,195 |
2,416 |
|
New York State Manufacturing Employment, 2000 - 2014 |
|---|
|
|
2014 |
2013 |
2012 |
2011 |
2004 |
2000 |
|
Manufacturing - All |
450,192 |
454,286 |
456,930 |
456,807 |
593,521 |
745,585 |
|
Computer & Electronic Product Manufacturing |
56,555 |
58,446 |
60,444 |
61,959 |
74,293 |
86,885 |
|
Food Manufacturing |
52,756 |
52,521 |
51,561 |
49,709 |
51,932 |
54,966 |
|
Fabricated Metal Product Manufacturing |
51,313 |
51,201 |
50,932 |
49,611 |
57,022 |
69,268 |
|
Machinery Manufacturing |
42,089 |
42,647 |
43,366 |
44,402 |
51,911 |
68,893 |
|
Chemical Manufacturing |
38,034 |
39,882 |
40,286 |
40,293 |
56,739 |
67,104 |
|
Printing & Related Support Activities |
21,247 |
21,731 |
22,044 |
22,547 |
36,739 |
43,793 |
|
Plastics & Rubber Products Manufacturing |
20,785 |
20,614 |
20,819 |
20,783 |
26,681 |
33,124 |
|
Transportation Equipment Manufacturing |
20,439 |
20,077 |
21,104 |
22,514 |
37,469 |
45,078 |
|
Apparel Manufacturing |
18,453 |
19,020 |
19,630 |
19,540 |
37,188 |
65,182 |
|
Paper Manufacturing |
16,354 |
16,594 |
16,444 |
16,441 |
21,250 |
27,353 |
|
Nonmetallic Mineral Product Manufacturing |
15,117 |
15,051 |
15,057 |
14,830 |
17,976 |
22,635 |
|
Furniture & Related Product Manufacturing |
13,257 |
13,285 |
12,933 |
12,938 |
18,701 |
23,227 |
|
Textile Mills |
3,692 |
3,742 |
3,694 |
3,851 |
6,804 |
11,546 |
Source: NYS Department of Labor, Quarterly Census of Employment and Wages (QCEW).
Employment figures are annual totals.