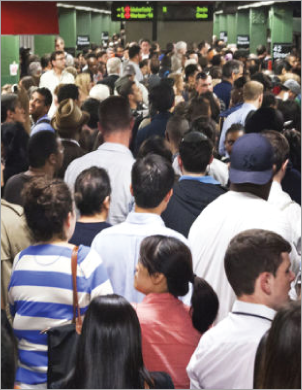
New Yorkers are efficient, direct and fast moving. Their commutes: anything but. In all but one of New York City’s 55 Census-defined neighborhoods, the average commute time exceeds the national average of 26 minutes. In 69 percent of the city’s neighborhoods, the average commute to work is over 40 minutes.
This research was made possible through general operating support from the Bernard F. and Alva B. Gimbel Foundation, the Lucius N. Littauer Foundation and the M&T Charitable Foundation.
This data brief details the average commute times for each of the city’s neighborhoods; compares commuting times for workers in different industries; shows which forms of commuting (car, transit or walking) are most prevalent in each neighborhood; and shows that the number of residents commuting to work in their own borough continues to rise.
While nearly every New Yorker suffers through a long commute, the length varies depending on the borough and neighborhoodsi where they reside. Average commutesii range from 53 minutes in the Rockaways to 26 minutes in the Financial District and Greenwich Village. In other words, over the course of a five day work week, Rockaway residents will spend four hours and 29 minutes more time commuting than those who live in Downtown Manhattan. Of the ten neighborhoods with the longest commutes, four are in Brooklyn, four are in Queens and two are in the Bronx. Of those with the shortest commutes, all but one is in Manhattan. However, even in neighborhoods closely located to the Manhattan jobs centers, commuting times are extensive. The average commute for residents of Astoria is 38 minutes and for Williamsburg, 36 minutes.
The ten neighborhoods with the longest commutes are: the Rockaways (53 minutes), Jamaica (51 minutes), Brownsville/Ocean Hill (48 minutes), Flatlands/Canarsie (48 minutes), Bellerose/Rosedale (47 minutes), Howard Beach/S. Ozone Park (46 minutes), Kingsbridge Heights/Mosholu (46 minutes), Soundview/Parkchester (46 minutes), East Flatbush (46 minutes) and Bensonhurst (45 minutes).
The three longest commutes in the Bronx are from Kingsbridge Heights/Mosholu (46 minutes), Soundview/Parkchester (46 minutes) and Williamsbridge/Baychester (44 minutes). The three longest commutes in Brooklyn are from Brownsville/Ocean Hill (48 minutes), Flatlands/Canarsie (48 minutes) and East Flatbush (46 minutes). The three longest commutes in Manhattan are from Washington Heights/Inwood (41 minutes), East Harlem (35 minutes) and Central Harlem (34 minutes). The three longest commutes in Queens are from Rockaways (53 minutes), Jamaica (51 minutes) and Bellerose/Rosedale (47 minutes). The longest commute in Staten Island is from South Shore (45 minutes).
Modes of transportation also vary by neighborhood. While 59 percent of New Yorkers use mass transit to get to work, in 10 of the city’s 55 neighborhoods, more commuters rely on cars or taxis than any other form of transportation. This is the case in all three Census-defined neighborhoods in Staten Island, six neighborhoods in Queens and one neighborhood in the Bronx. In another six of the city’s neighborhoods, over 20 percent of commuters walk or bike to work, including Stuyvesant Town (40 percent), Chelsea/Midtown (35 percent), Lower East Side (34 percent), Greenwich Village/FiDi (34 percent), Upper East Side (25 percent) and Borough Park (22 percent). The five neighborhoods with the highest share of bike commuters are Lower East Side/Chinatown (where six percent of commuters bike to work), Greenwich Village/Financial District (5 percent), North Crown Heights/Prospect Heights (5 percent), Brooklyn Heights/Fort Greene (5 percent) and Park Slope/Carroll Gardens (4 percent).
Many New Yorkers avoid commuting altogether. In six neighborhoods, more than seven percent of employed residents are primarily working from home (Upper West Side, Park Slope/Carroll Gardens, Chelsea/Clinton/Midtown, Stuyvesant Town/Turtle Bay, Greenwich Village/Financial District and Brooklyn Heights/Fort Greene). Interestingly, it is those neighborhoods with the closest proximity to job centers and the best transit options that have the highest share of residents who work out of their home. The number of New Yorkers working from home increased by 68 percent from 2000 to 2014 and now represents 3.9 percent of the city’s working population.
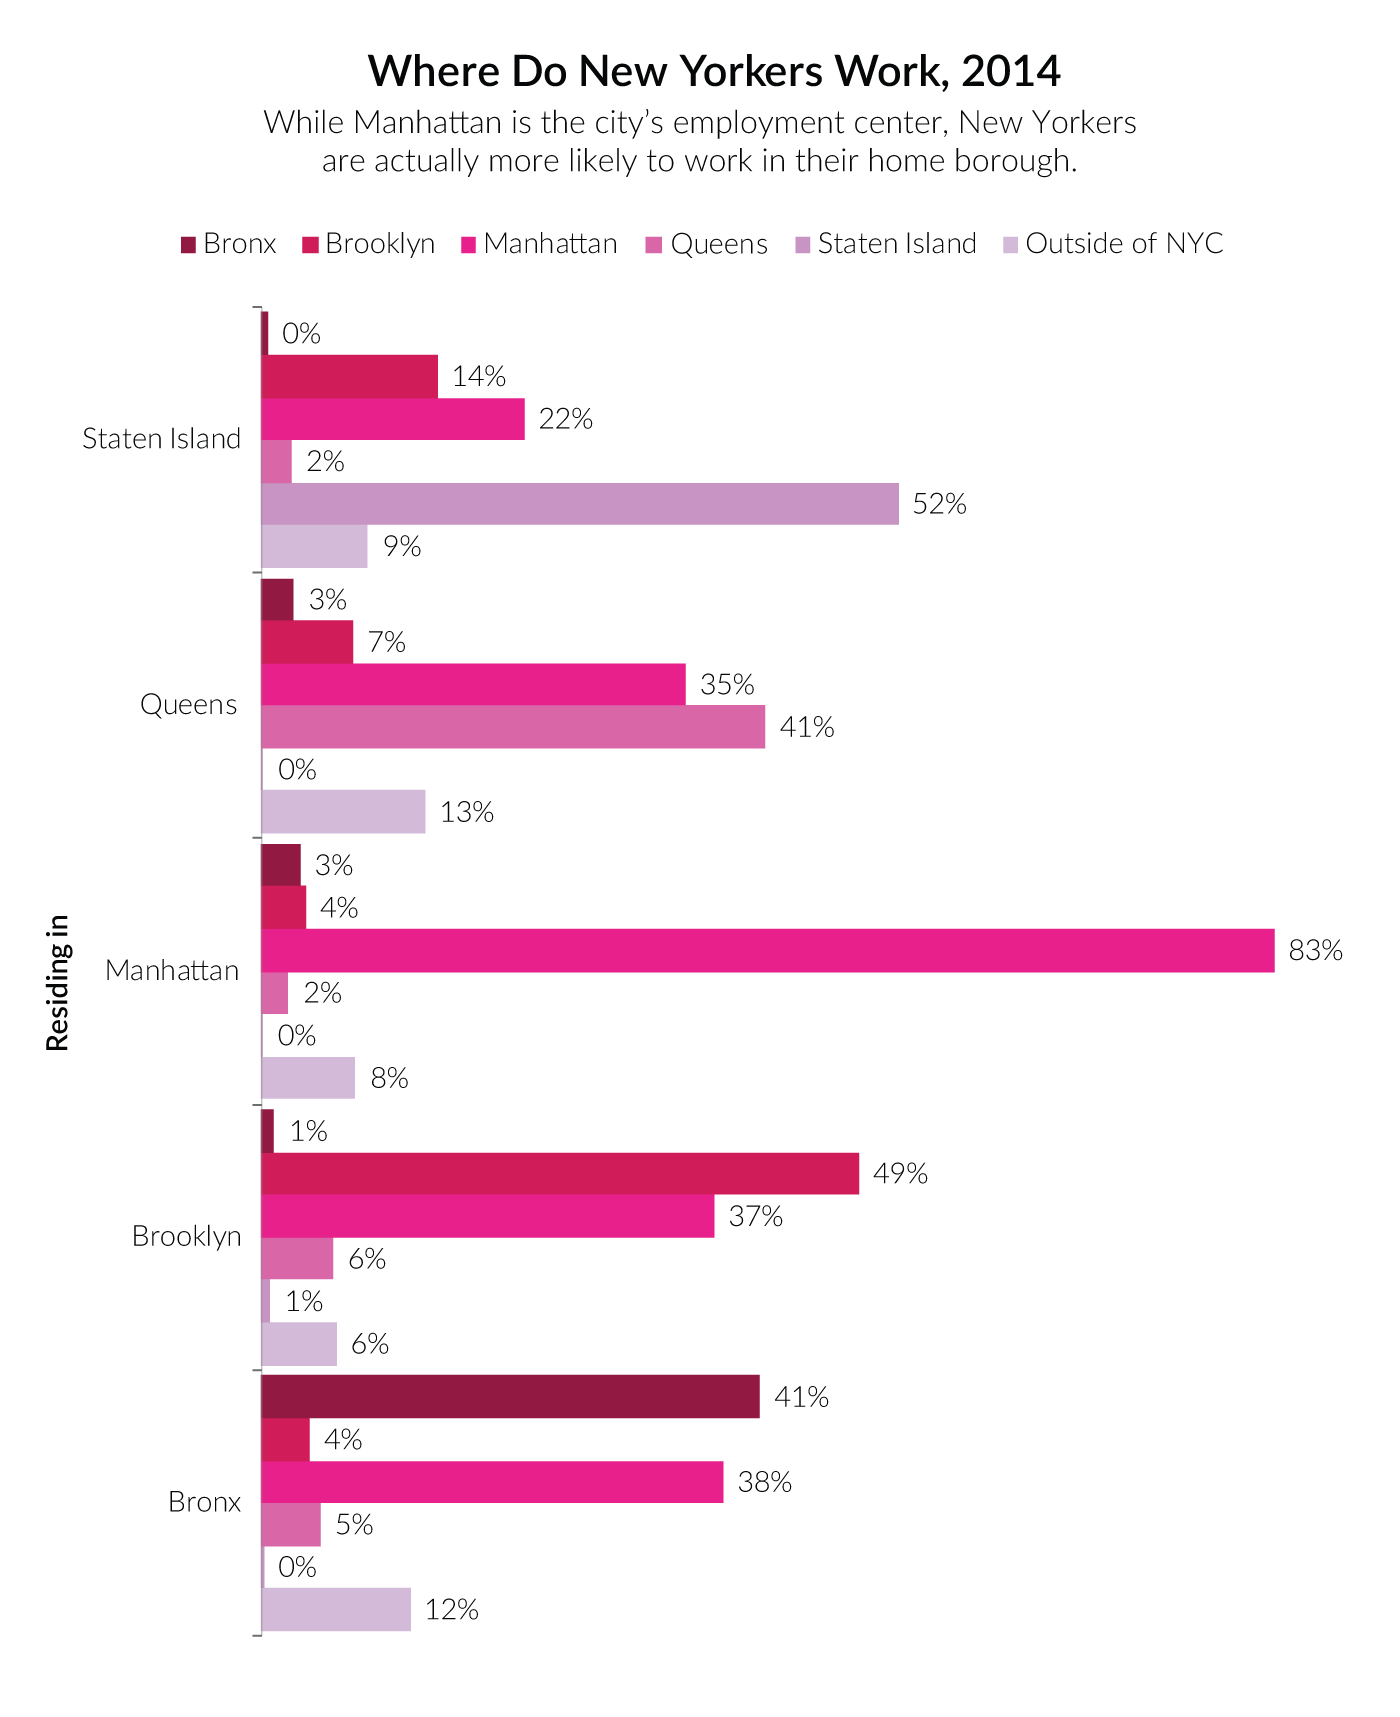
While Manhattan is clearly the city’s employment center, New Yorkers are actually more likely to commute to work in their own borough. Among Bronx commuters, 41 percent work in their home borough while 38 percent are employed in Manhattan. The gap is even larger in Queens (41 percent versus 35 percent), Brooklyn (49 percent versus 37 percent) and especially Staten Island (52 percent versus 22 percent).
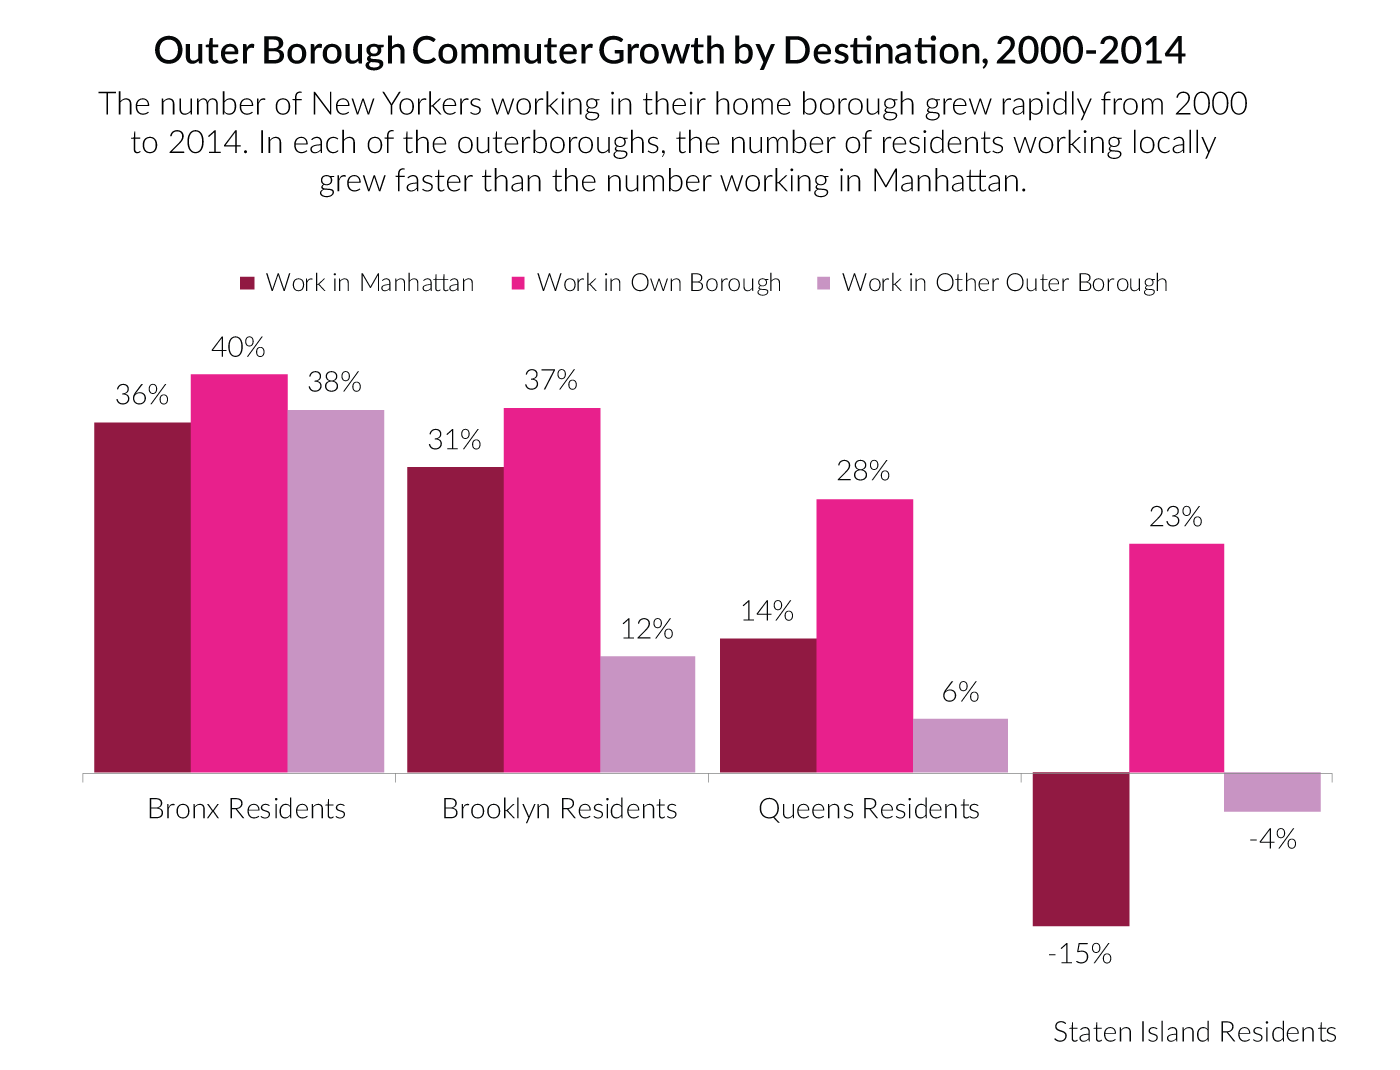
From 2000 to 2014, the number of New Yorkers working in their home borough increased by 40 percent in the Bronx (from 168,849 to 237,156), 37 percent in Brooklyn (from 431,243 to 591,487), 28 percent in Queens (from 363,822 to 465,506), 23 percent in Staten Island (from 87,259 to 107,542) and 18 percent in Manhattan (from 635,122 to 747,996).
Queens residents are the most likely to work outside of the city. Thirteen percent commute to jobs beyond the five boroughs, followed by the Bronx (12 percent), Staten Island (9 percent), Manhattan (8 percent) and Brooklyn (6 percent).
Beyond neighborhoods and boroughs, commuting patterns also vary by industry. In several sectors, for instance, a large share of employees do not live in New York. In the city’s utilities sector, 40 percent of employees commute from outside of the city. Other sectors with a high share of workers commuting from outside the city include finance and insurance (38 percent) and government (30 percent). By contrast, the preponderance of those working in New York’s lowest paying sectors—retail, tourism, food services—reside inside the city. All but 10 percent of employees in accommodation and food services, 15 percent in retail and 15 percent in healthcare live in New York City. On the whole, 79 percent of jobs in the New York are filled by city residents. This has changed little since 2000, when 78 percent of New York jobs were occupied by city residents.
Given the large share of non-New Yorkers working in the city’s finance and insurance sector, it is unsurprising that it is the industry with the longest average commute: 51 minutes. It is followed by construction (50 minutes), public administration (48 minutes) and manufacturing (48 minutes). Employees in the educational services sector, on the other hand, have the shortest average commutes (40 minutes), followed by those working in arts and entertainment (41 minutes), real estate (41 minutes) and retail (42 minutes).
To reduce commuting times for those living inside and outside of New York, the city will have to improve and expand its transit options. To this end, the Center’s 2014 report on New York City infrastructure, Caution Ahead, offered several recommendations for increasing the efficiency of the city’s subway system and financing expansion.
First, it recommended an accelerated schedule for the modernization of the MTA’s signal system. Adopting Communications Based Train Control across the subway system will increase the frequency and speed of the city’s trains.
Second, it recommended the adoption of the Move NY plan, introducing tolls on the city’s East River bridges. The plan would generate $1.5 billion in net annual revenue for the MTA, helping to improve state-of-good-repair and to finance system expansion.
Finally, while the MTA operates over 20 LIRR stations in the five boroughs, few New Yorkers use the service because of its high fares and its poor integration with the subway MetroCard. Reducing fares and integrating payment and transfers within the city could dramatically reduce commutes in transit deserts like northeast and southeast Queens.
Mass Transit Drive/Taxi Bike/Walk
| Average Commuting Time by Neighborhood of Residence, 2014 |
|---|
| Neighborhood | Borough | Average Commute Time |
| Rockaways | Queens | 52.9 |
| Jamaica | Queens | 50.9 |
| Brownsville/Ocean Hill | Brooklyn | 48.2 |
| Flatlands/Canarsie | Brooklyn | 48.1 |
| Bellerose/Rosedale | Queens | 46.9 |
| Howard Beach/S. Ozone Park | Queens | 46.2 |
| Kingsbridge Heights/Mosholu | Bronx | 46.1 |
| Soundview/Parkchester | Bronx | 45.8 |
| East Flatbush | Brooklyn | 45.6 |
| Bensonhurst | Brooklyn | 45.4 |
| East New York/Starrett City | Brooklyn | 44.8 |
| Kew Gardens/Woodhaven | Queens | 44.6 |
| South Shore | Staten Island | 44.6 |
| Bay Ridge | Brooklyn | 44.5 |
| Elmhurst/Corona | Queens | 44.4 |
| Williamsbridge/Baychester | Bronx | 44.3 |
| Riverdale/Kingsbridge | Bronx | 43.7 |
| Sheepshead Bay/Gravesend | Brooklyn | 43.5 |
| Sunset Park | Brooklyn | 43.2 |
| Throgs Neck/Co-op City | Bronx | 43.1 |
| Coney Island | Brooklyn | 43.0 |
| North Shore | Staten Island | 42.7 |
| Bayside/Little Neck | Queens | 42.6 |
| Jackson Heights | Queens | 42.6 |
| Pelham Parkway | Bronx | 42.5 |
| Morrisania/East Tremont | Bronx | 42.3 |
| Hillcrest/Fresh Meadows | Queens | 42.3 |
| Mid-Island | Staten Island | 42.0 |
| Bedford Stuyvesant | Brooklyn | 41.9 |
| North Crown Heights/Prospect Heights | Brooklyn | 41.9 |
| Forest Hills/Rego Park | Queens | 41.7 |
| Mott Haven/Hunts Point | Bronx | 41.6 |
| University Heights/Fordham | Bronx | 41.6 |
| Washington Heights/Inwood | Manhattan | 41.4 |
| South Crown Heights | Brooklyn | 41.2 |
| Flatbush | Brooklyn | 40.9 |
| New York City | | 40.3 |
| Bushwick | Brooklyn | 40.3 |
| Highbridge/S. Concourse | Bronx | 40.0 |
| Middle Village/Ridgewood | Queens | 39.4 |
| Astoria | Queens | 38.3 |
| Park Slope/Carroll Gardens | Brooklyn | 38.0 |
| Flushing/Whitestone | Queens | 37.7 |
| Sunnyside/Woodside | Queens | 37.4 |
| Williamsburg/Greenpoint | Brooklyn | 36.2 |
| Brooklyn Heights/Fort Greene | Brooklyn | 36.0 |
| East Harlem | Manhattan | 35.1 |
| Borough Park | Brooklyn | 35.1 |
| Central Harlem | Manhattan | 34.4 |
| Morningside Heights/Hamilton Heights | Manhattan | 33.1 |
| Upper West Side | Manhattan | 31.8 |
| Upper East Side | Manhattan | 31.8 |
| Lower East Side/Chinatown | Manhattan | 30.1 |
| Chelsea/Clinton/Midtown | Manhattan | 27.8 |
| Stuyvesant Town/Turtle Bay | Manhattan | 27.0 |
| Greenwich Village/Financial District | Manhattan | 26.1 |
| Method of Transit by Neighborhood of Residence, 2014 |
|---|
| Neighborhood | Borough | Mass Transit | Drive or Taxi | Walk/Bike |
| East Harlem | Manhattan | 78% | 10% | 12% |
| Central Harlem | Manhattan | 77% | 10% | 11% |
| Highbridge/S. Concourse | Bronx | 77% | 17% | 5% |
| Washington Heights/Inwood | Manhattan | 77% | 12% | 10% |
| Upper West Side | Manhattan | 76% | 11% | 12% |
| Morningside Heights/Hamilton Heights | Manhattan | 76% | 10% | 13% |
| Mott Haven/Hunts Point | Bronx | 74% | 14% | 11% |
| Kingsbridge Heights/Mosholu | Bronx | 74% | 15% | 10% |
| Brooklyn Heights/Fort Greene | Brooklyn | 73% | 14% | 13% |
| Sunnyside/Woodside | Queens | 73% | 23% | 4% |
| Brownsville/Ocean Hill | Brooklyn | 72% | 23% | 5% |
| Bushwick | Brooklyn | 72% | 14% | 13% |
| South Crown Heights | Brooklyn | 72% | 19% | 9% |
| East New York/Starrett City | Brooklyn | 72% | 23% | 4% |
| North Crown Heights/Prospect Heights | Brooklyn | 72% | 16% | 12% |
| Park Slope/Carroll Gardens | Brooklyn | 71% | 13% | 15% |
| University Heights/Fordham | Bronx | 71% | 17% | 9% |
| Astoria | Queens | 71% | 21% | 8% |
| Bedford Stuyvesant | Brooklyn | 70% | 17% | 12% |
| Sunset Park | Brooklyn | 69% | 16% | 13% |
| East Flatbush | Brooklyn | 68% | 28% | 4% |
| Morrisania/East Tremont | Bronx | 68% | 22% | 10% |
| Elmhurst/Corona | Queens | 67% | 23% | 9% |
| Williamsburg/Greenpoint | Brooklyn | 66% | 20% | 14% |
| Jackson Heights | Queens | 64% | 27% | 8% |
| Flatbush | Brooklyn | 63% | 28% | 9% |
| Forest Hills/Rego Park | Queens | 61% | 33% | 5% |
| Bensonhurst | Brooklyn | 61% | 30% | 8% |
| Soundview/Parkchester | Bronx | 61% | 34% | 4% |
| New York City | | 59% | 29% | 11% |
| Bay Ridge | Brooklyn | 59% | 31% | 10% |
| Upper East Side | Manhattan | 59% | 15% | 25% |
| Kew Gardens/Woodhaven | Queens | 58% | 36% | 6% |
| Riverdale/Kingsbridge | Bronx | 57% | 33% | 9% |
| Greenwich Village/Financial District | Manhattan | 57% | 9% | 34% |
| Middle Village/Ridgewood | Queens | 57% | 37% | 6% |
| Lower East Side/Chinatown | Manhattan | 56% | 10% | 34% |
| Chelsea/Clinton/Midtown | Manhattan | 54% | 10% | 35% |
| Williamsbridge/Baychester | Bronx | 53% | 41% | 6% |
| Jamaica | Queens | 52% | 44% | 3% |
| Pelham Parkway | Bronx | 52% | 40% | 7% |
| Coney Island | Brooklyn | 51% | 34% | 14% |
| Sheepshead Bay/Gravesend | Brooklyn | 51% | 38% | 10% |
| Flatlands/Canarsie | Brooklyn | 51% | 44% | 4% |
| Stuyvesant Town/Turtle Bay | Manhattan | 51% | 8% | 40% |
| Borough Park | Brooklyn | 49% | 28% | 22% |
| Hillcrest/Fresh Meadows | Queens | 44% | 48% | 7% |
| Throgs Neck/Co-op City | Bronx | 42% | 51% | 6% |
| Howard Beach/S. Ozone Park | Queens | 42% | 53% | 4% |
| Rockaways | Queens | 40% | 53% | 4% |
| Flushing/Whitestone | Queens | 37% | 49% | 14% |
| North Shore | Staten Island | 36% | 60% | 4% |
| Bellerose/Rosedale | Queens | 34% | 65% | 1% |
| Bayside/Little Neck | Queens | 34% | 63% | 3% |
| Mid-Island | Staten Island | 32% | 65% | 3% |
| South Shore | Staten Island | 22% | 76% | 1% |
| Share of Residents Who Work from Home by Neighborhood, 2014 |
|---|
| Neighborhood | Borough | Share of Residents Who Work from Home |
| Astoria | Queens | 3.8% |
| Bay Ridge | Brooklyn | 4.8% |
| Bayside / Little Neck | Queens | 4.0% |
| Bedford Stuyvesant | Brooklyn | 5.1% |
| Bellerose / Rosedale | Queens | 2.3% |
| Bensonhurst | Brooklyn | 2.4% |
| Borough Park | Brooklyn | 4.3% |
| Brooklyn Heights / Fort Greene | Brooklyn | 7.2% |
| Brownsville / Ocean Hill | Brooklyn | 2.4% |
| Bushwick | Brooklyn | 3.2% |
| Central Harlem | Manhattan | 3.9% |
| Chelsea / Clinton / Midtown | Manhattan | 8.2% |
| New York City | | 3.9% |
| Coney Island | Brooklyn | 1.9% |
| East Flatbush | Brooklyn | 3.1% |
| East Harlem | Manhattan | 3.4% |
| East New York / Starrett City | Brooklyn | 1.7% |
| Elmhurst / Corona | Queens | 0.5% |
| Flatbush | Brooklyn | 2.6% |
| Flatlands / Canarsie | Brooklyn | 2.9% |
| Flushing / Whitestone | Queens | 2.3% |
| Forest Hills / Rego Park | Queens | 4.4% |
| Greenwich Village / Financial District | Manhattan | 7.2% |
| Highbridge / S. Concourse | Bronx | 5.7% |
| Hillcrest / Fresh Meadows | Queens | 2.6% |
| Howard Beach / S. Ozone Park | Queens | 0.8% |
| Jackson Heights | Queens | 0.8% |
| Jamaica | Queens | 1.8% |
| Kew Gardens / Woodhaven | Queens | 4.5% |
| Kingsbridge Heights / Mosholu | Bronx | 5.7% |
| Lower East Side / Chinatown | Manhattan | 3.6% |
| Middle Village / Ridgewood | Queens | 2.4% |
| Mid-Island | Staten Island | 5.9% |
| Morningside Heights / Hamilton Heights | Manhattan | 6.0% |
| Morrisania / East Tremont | Bronx | 4.6% |
| Mott Haven / Hunts Point | Bronx | 3.5% |
| North Crown Heights / Prospect Heights | Brooklyn | 3.3% |
| North Shore | Staten Island | 1.2% |
| Park Slope / Carroll Gardens | Brooklyn | 8.4% |
| Pelham Parkway | Bronx | 2.4% |
| Riverdale / Kingsbridge | Bronx | 3.8% |
| Rockaways | Queens | 4.5% |
| Sheepshead Bay / Gravesend | Brooklyn | 4.3% |
| Soundview / Parkchester | Bronx | 2.8% |
| South Crown Heights | Brooklyn | 3.0% |
| South Shore | Staten Island | 1.2% |
| Stuyvesant Town / Turtle Bay | Manhattan | 7.8% |
| Sunnyside / Woodside | Queens | 1.9% |
| Sunset Park | Brooklyn | 2.6% |
| Throgs Neck / Co-op City | Bronx | 1.9% |
| University Heights / Fordham | Bronx | 3.7% |
| Upper East Side | Manhattan | 6.4% |
| Upper West Side | Manhattan | 9.3% |
| Washington Heights / Inwood | Manhattan | 4.6% |
| Williamsbridge / Baychester | Bronx | 1.8% |
| Williamsburg / Greenpoint | Brooklyn | 6.3% |
| Industry Share of New York City Jobs Filled by Non-City Residents, 2014 |
|---|
| Industry | Share of Employees Who Live Outside New York City |
| Utilities | 40% |
| Finance and Insurance | 38% |
| Public Administration | 30% |
| Management of companies and enterprises | 29% |
| Wholesale Trade | 28% |
| Professional, Scientific, and Technical Services | 28% |
| Construction | 26% |
| Manufacturing | 26% |
| Information | 25% |
| Educational Services | 21% |
| Average | 21% |
| Transportation and Warehousing | 21% |
| Real Estate and Rental and Leasing | 20% |
| Administrative and support and waste management services | 17% |
| Arts, Entertainment, and Recreation | 16% |
| Personal Services and Repair Services | 15% |
| Health Care and Social Assistance | 15% |
| Retail Trade | 15% |
| Accommodation and Food Services | 10% |
| Average Commuting Time by Industry, 2014 |
|---|
| Industry | Average Commute Time |
| Finance and Insurance | 51 |
| Construction | 50 |
| Public Administration | 48 |
| Manufacturing | 48 |
| Information | 47 |
| Utilities | 47 |
| Administrative and support and waste management services | 47 |
| Professional, Scientific, and Technical Services | 46 |
| Average | 45 |
| Health Care and Social Assistance | 44 |
| Wholesale Trade | 44 |
| Transportation and Warehousing | 44 |
| Management of companies and enterprises | 43 |
| Personal Services and Repair Services | 43 |
| Accommodation and Food Services | 43 |
| Retail Trade | 42 |
| Real Estate and Rental and Leasing | 41 |
| Arts, Entertainment, and Recreation | 41 |
| Educational Services | 40 |
1 This data brief is drawn from the U.S. Census Bureau’s 2014 American Community Survey.
2 Average commuting times exclude those who do not work or work from home.
