New York City’s public libraries are now open nearly four hours more per week on average than this time last year, and are no longer next to last in average hours of operation among the state’s largest counties. But while virtually all library branches in the five boroughs are now open six days a week—thanks to the $43 million increase in operating funds for libraries that was agreed to by Mayor de Blasio and the City Council last June—New York City’s libraries are still open fewer hours than most of the largest library systems in the state and the nation.
This data analysis is part of a series of research briefs on New York City public libraries that was generously funded by the Charles H. Revson Foundation.
General operating support for the Center for an Urban Future is provided by the Bernard F. and Alva B. Gimbel Foundation; with additional support from the Lucius N. Littauer Foundation and the M&T Charitable Foundation.
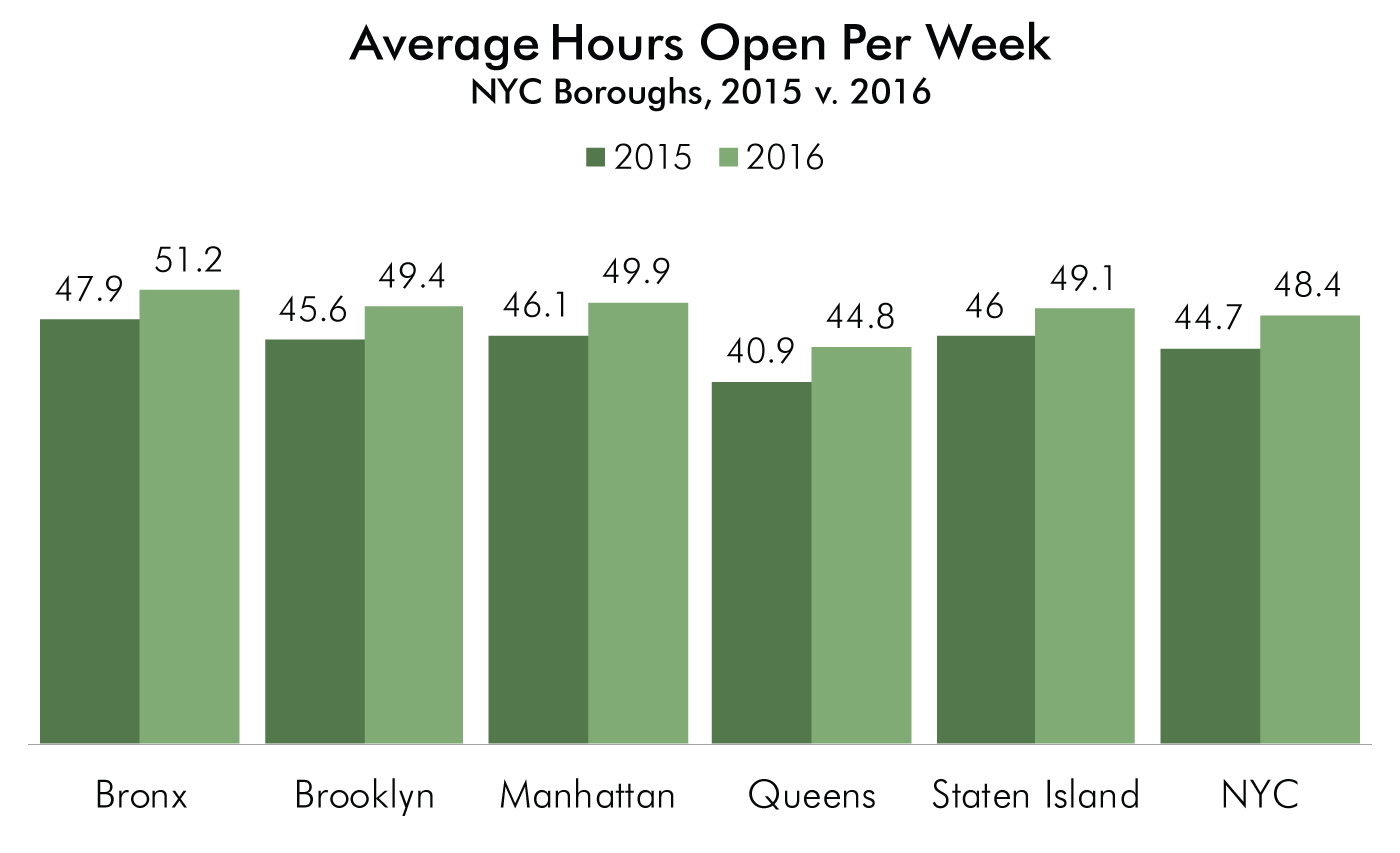
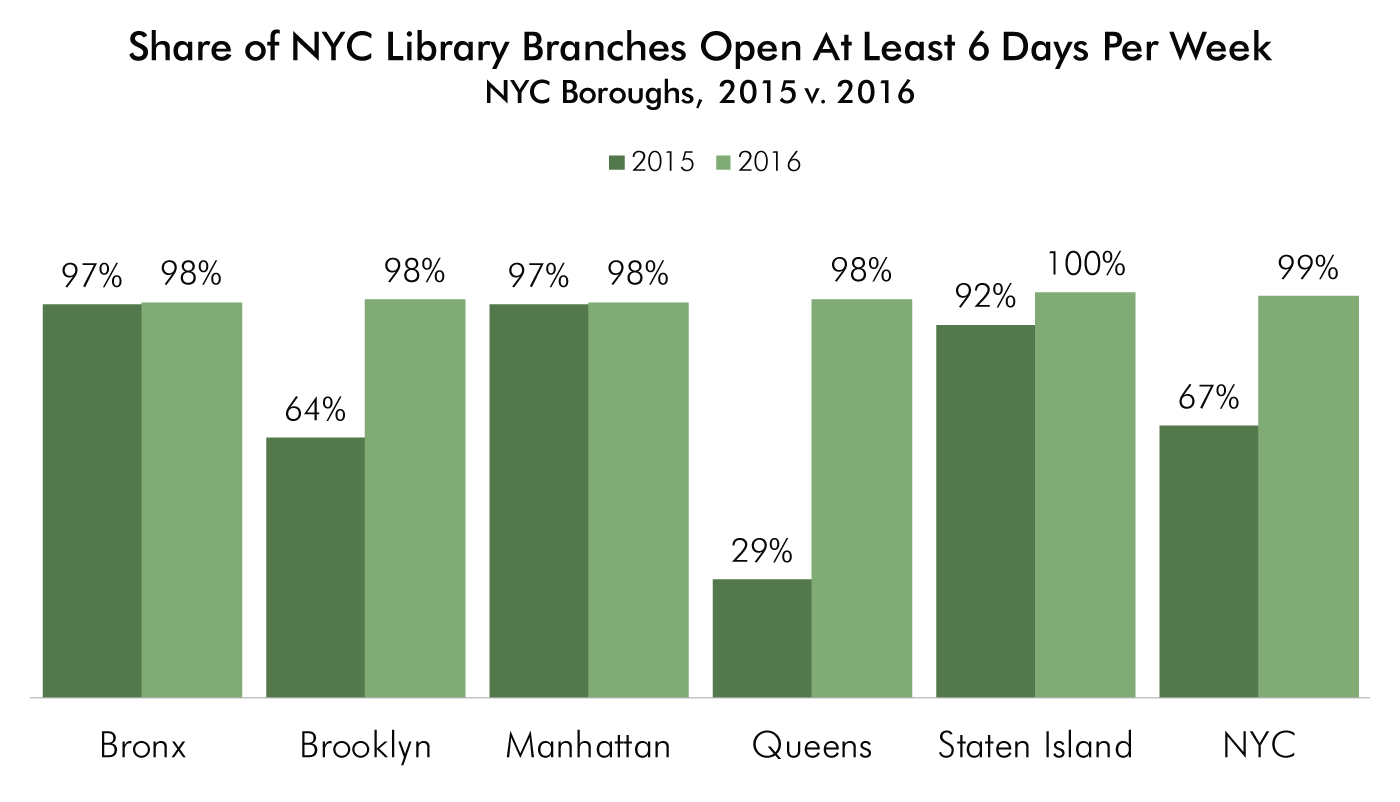
Our second annual assessment of library hours in New York State shows that New York City’s public libraries are now open an average of 48.4 hours per week, a notable increase from this time last year, when the city’s libraries were open 44.7 hours a week on average. Moreover, 99 percent of the city’s branch libraries are now open 6 days a week, up from 67 percent a year ago. The biggest changes occurred in Queens and Brooklyn. Last year at this time, just 29 percent of library branches in Queens and 64 percent of branches in Brooklyn were open at least six days a week; today, 98 percent of branches in both Queens and Brooklyn are open six days a week.
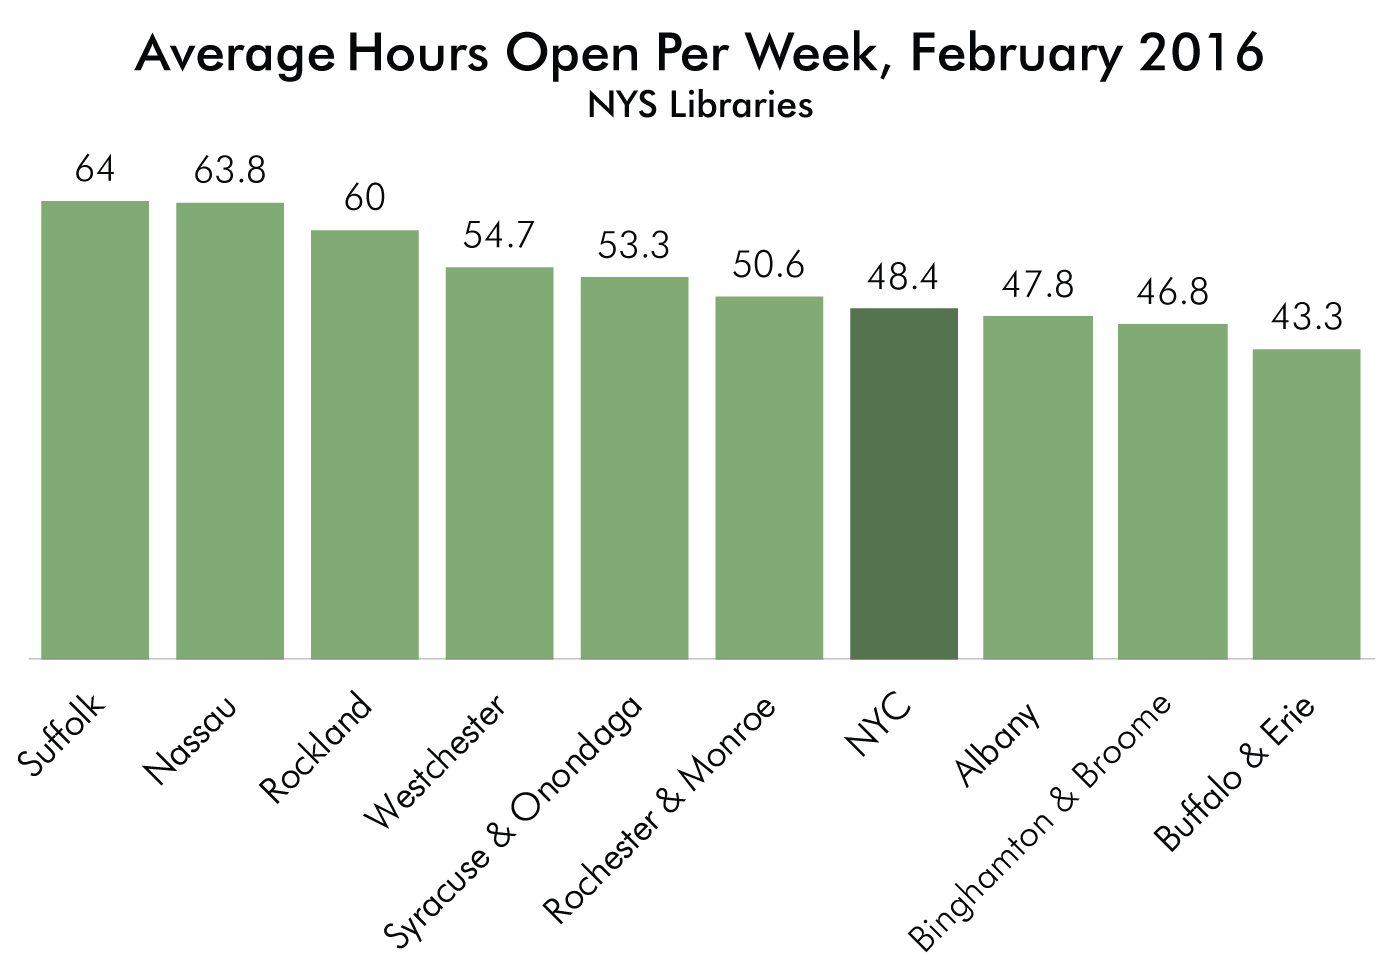
Last year at this time, New York City’s public libraries were open fewer hours than all the state’s major counties except Erie County. Today, libraries across the five boroughs are open more hours per week than Erie (which are open 43.3 hours per week), Albany (47.8 hours/week) and Broome (46.8 hours) counties. But the city’s libraries are still open significantly less than the public libraries in Suffolk County (which are open 64 hours per week), Nassau County (63.8 hours/week), Rockland County (60 hours), Westchester County (54.7 hours), Onondaga County (53.3 hours), and Monroe County (50.6 hours).
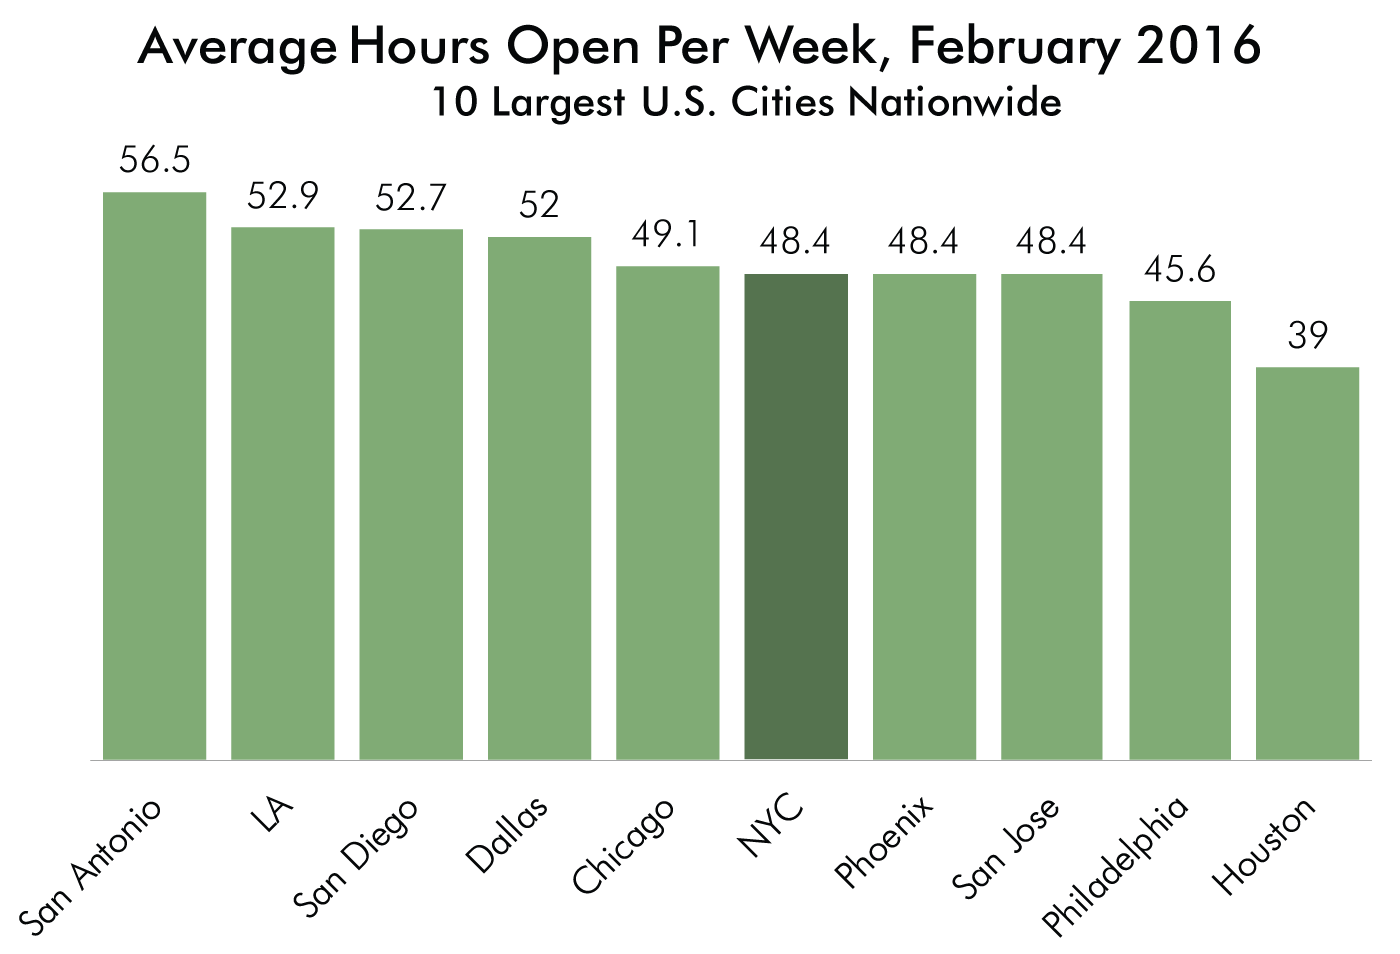
Our analysis also compares New York City’s public libraries with library systems in the nation’s 10 largest cities. We find that New York’s public libraries fall into the bottom half of large urban libraries nationally when it comes to service hours. Out of the country’s ten largest cities, New York is tied for sixth place alongside the cities of Phoenix and San Jose, all of which are open 48.4 hours per week on average. This is slightly better than last year, when New York ranked eighth in average hours of operation among the 10 largest cities. Today, New York City’s public libraries are open more hours per week than libraries in Philadelphia (45.6 hours) and Houston (39 hours) but offer fewer service hours than libraries in San Antonio (which are open 56.5 hours per week), Los Angeles (52.9 hours), San Diego (52.7 hours), Dallas (52 hours) and Chicago (49.1 hours).
Among New York City boroughs, libraries in the Bronx were open the most hours (51.2 hours per week), followed by Manhattan (49.9 hours), Brooklyn (49.4 hours), Staten Island (49.1 hours) and Queens (44.8 hours). Each of the boroughs experienced a notable increase in library hours over the past year: the Bronx went from 48 to 51.2; Manhattan from 46 to 49.9; Brooklyn from 46 to 49.4; Staten Island from 46 to 49.1; and Queens from 41 to 44.8.
The increase in library hours—made possible by last June’s historic increase in city operating support for the city’s three public library systems—has provided a huge boost to New Yorkers, who are increasingly turning to library branches to gain the essential literacy, language and technological skills needed in today’s economy. Simply put, more branches are now open more days and longer hours, enabling adults to upgrade their skills and find jobs, helping immigrants learn English, fostering reading skills in young people and providing technology access for those who don’t have a computer or an Internet connection at home.
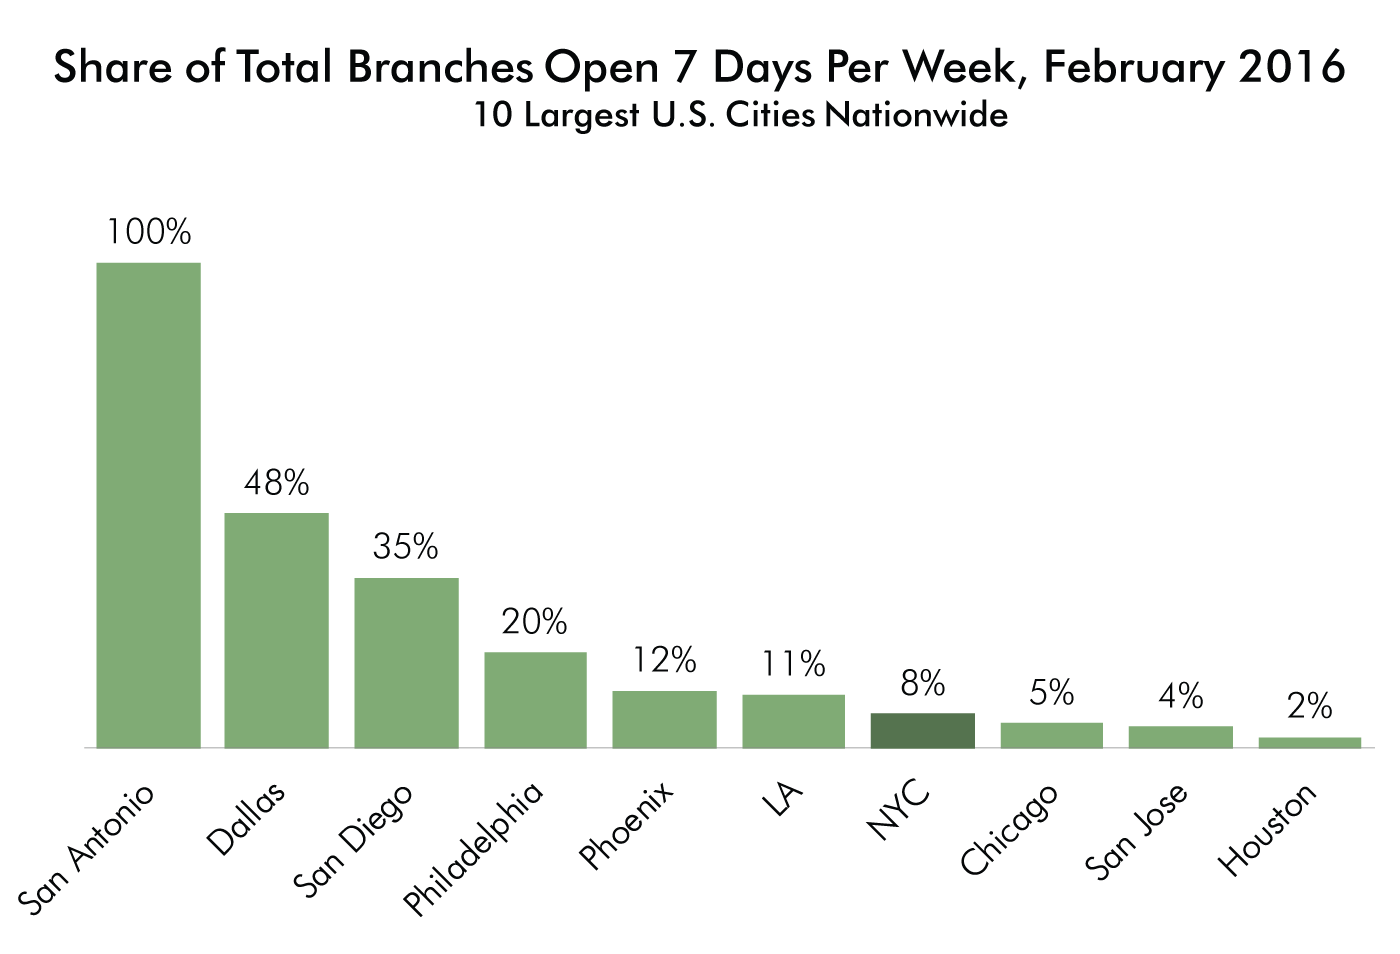
Despite the clear gains in hours of operation for New York City’s branch libraries, however, just 8 percent of the city’s library branches are open seven days a week, compared to 90 percent of Suffolk County libraries, 88 percent of Rockland County libraries, 71 percent of Nassau County libraries and 62.7 percent of Westchester County libraries.
This data brief is based on an assessment of posted library hours that we conducted in February and March of 2016.
|
Library Service Hours by NYC Borough, 2016 vs 2015 |
|---|
|
County |
Avg Hours Open per Week, 2016 |
Avg Hours Open per Week, 2015 |
Branches Open at Least 6 Days, 2016 |
Branches Open at Least 6 Days, 2015 |
|
Bronx |
51.2 |
47.9 |
98% |
97% |
|
Manhattan |
49.9 |
46.1 |
98% |
97% |
|
Brooklyn |
49.4 |
45.6 |
98% |
64% |
|
Staten Island |
49.1 |
46 |
100% |
92% |
|
Queens |
44.8 |
40.9 |
98% |
29% |
|
Library Service Hours in New York State's Largest Counties, 2016 |
|---|
|
County |
Avg Hours Open per Week |
Branches Open 7 Days |
Branches Open at Least 6 Days |
|
Suffolk |
64 |
90% |
98% |
|
Nassau |
63.8 |
71% |
100% |
|
Rockland |
60 |
88% |
100% |
|
Westchester |
54.7 |
63% |
95% |
|
Onondaga |
53.3 |
38% |
94% |
|
Monroe |
50.6 |
26% |
97% |
|
NYC (all) |
48.4 |
8% |
99% |
|
Albany |
47.8 |
42% |
89% |
|
Broome |
46.8 |
0% |
78% |
|
Erie |
43.3 |
24% |
54% |
|
Library Service Hours in Ten Largest Cities Nationwide, 2016 |
|---|
|
City |
Avg Hours Open per Wk |
Branches Open 7 Days |
Branches Open at Least 6 Days |
|
San Antonio |
56.5 |
100% |
100% |
|
LA |
52.9 |
11% |
100% |
|
San Diego |
52.7 |
35% |
100% |
|
Dallas |
52 |
48% |
52% |
|
Chicago |
49.1 |
5% |
99% |
|
NYC |
48.4 |
8% |
99% |
|
Phoenix |
48.4 |
12% |
100% |
|
San Jose |
48.4 |
4% |
100% |
|
Philadelphia |
45.6 |
20% |
75% |
|
Houston |
39 |
2% |
50% |