In Branches of Opportunity (2013), the Center for an Urban Future documented how New York’s seniors, immigrants, K-12 students and unemployed were using their public libraries, and how visits, book circulation and program attendance were skyrocketing in the age of the Internet. Every year, New York’s 207 public libraries greet more visitors than all of the city’s professional sports teams and Cultural Institutions Group members combined, but their increasing value to communities across the five boroughs has not been widely acknowledged by policymakers. Funding is still down considerably from just a few years ago, and library hours are still sharply curtailed, especially when compared to other libraries across the state and country.
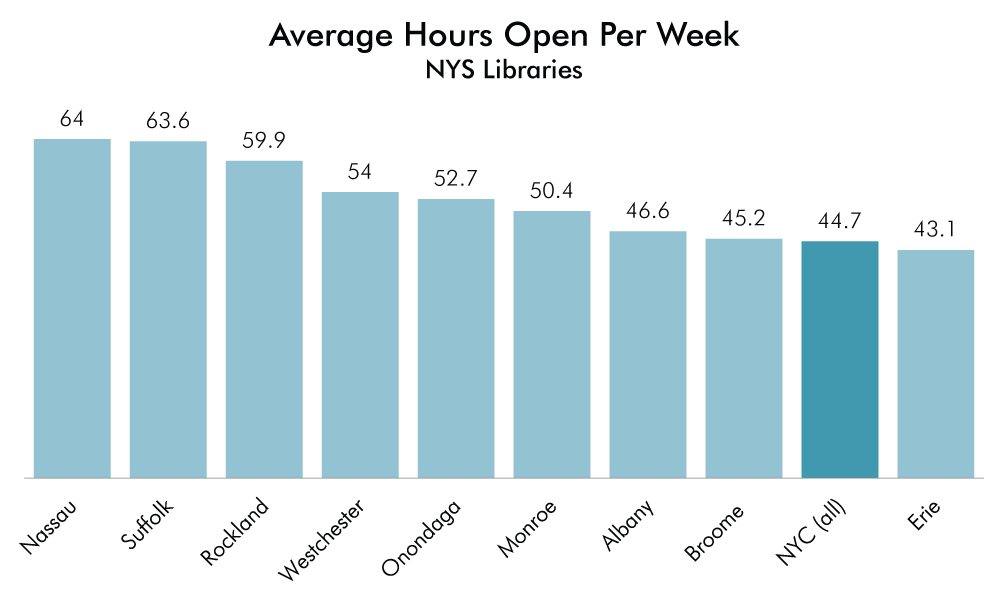
An assessment of posted library hours that we conducted over the past few months reveals that New York City public libraries are open fewer hours per week than every large county in New York State except one (Erie County). New York City public libraries are open an average of just 45 hours per week, significantly less than the public libraries in Suffolk and Nassau Counties (which are open 64 hours per week), Rockland County (60 hours), Westchester County (54 hours), Onondaga County (53 hours), and Monroe County (50 hours). Erie County libraries were open 43 hours per week.
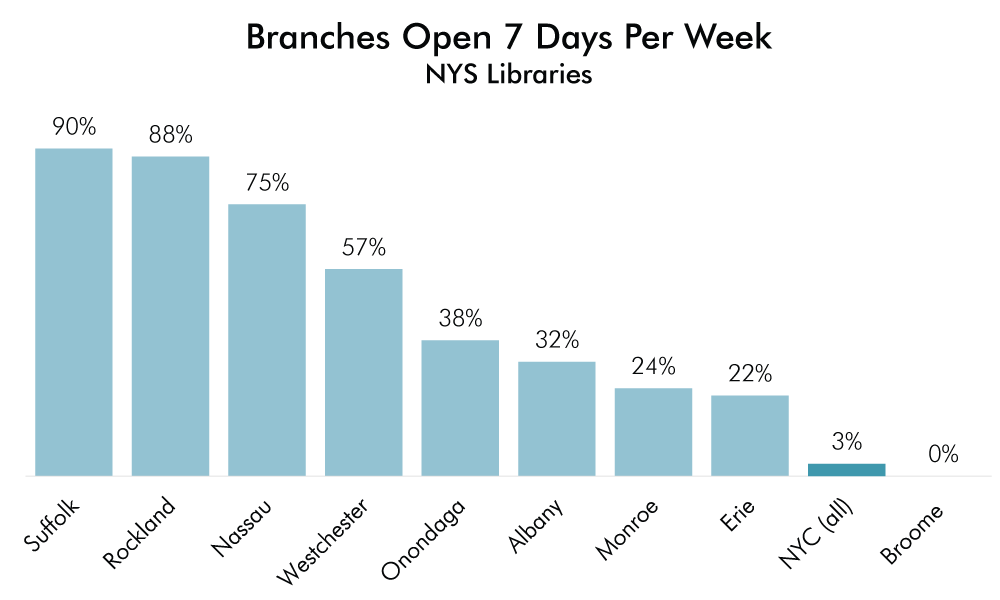
Moreover, just 3 percent of New York City libraries are open seven days a week, compared to 90 percent of Suffolk County libraries, 88 percent of Rockland County libraries, 75 percent of Nassau County libraries and 57 percent of Westchester County libraries.
Among New York City boroughs, Queens libraries are open the fewest hours on average (41 per week) and the Bronx the most (48 per week); Manhattan, Staten Island and Brooklyn are all open 46 hours per week on average. Whereas most libraries in the Bronx, Brooklyn, Manhattan and Staten Island are open at least 6 days a week, just 29 percent of Queens libraries open their doors that much.
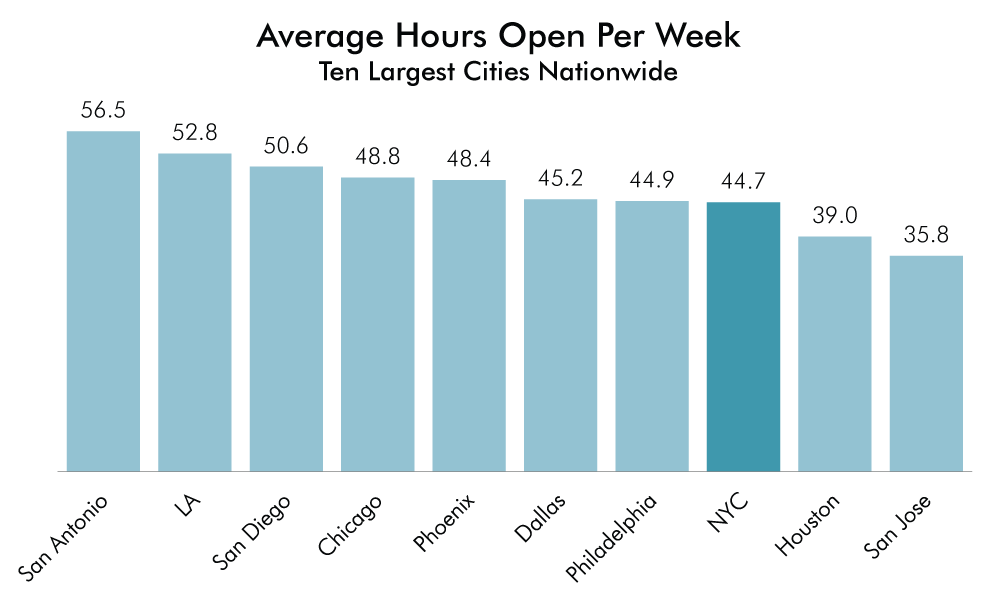
Our analysis also compared New York City’s public libraries with library systems in the nation’s 10 largest cities. We find that New York’s public libraries fall into the bottom half of large urban libraries nationally when it comes to service hours. Out of the country’s ten largest cities, New York ranks 7th. Just San Jose and Houston offer fewer service hours than the five boroughs. Public libraries in San Antonio are open 57 hours per week (with 100 percent open seven days), while those in Los Angeles are open 53 hours, San Diego 51 hours and Chicago 49 hours.
Library service hours are an enormously important barometer of their effectiveness. When libraries have to close early in the evening and on the weekends, fewer working families are able to take advantage of their resources, including not just books but classes and workshops. As Mayor de Blasio and the City Council negotiate a new budget, bringing the city’s library hours more in line with their peers across the state and country should be a high priority.
| Library Service Hours in New York State's Largest Counties |
|---|
| County | Avg Hours Open per Week | Branches open 7 days | Branches open at least 6 days |
| Nassau | 64 | 75% | 100% |
| Suffolk | 63.6 | 90% | 98% |
| Rockland | 59.9 | 88% | 100% |
| Westchester | 54 | 57% | 98% |
| Onondaga | 52.7 | 38% | 94% |
| Monroe | 50.4 | 24% | 97% |
| Albany | 46.6 | 32% | 89% |
| Broome | 45.2 | 0% | 78% |
| NYC (all) | 44.7 | 3% | 67% |
| Erie | 43.1 | 22% | 53% |
| Library Service Hours in Ten Largest Cities Nationwide |
|---|
| City | Avg Hours Open per Wk | Branches open 7 days | Branches open at least 6 days |
| San Antonio | 56.5 | 100% | 100% |
| LA | 52.8 | 11% | 100% |
| San Diego | 50.6 | 35% | 100% |
| Chicago | 48.8 | 5% | 97% |
| Phoenix | 48.4 | 53% | 53% |
| Dallas | 45.2 | 24% | 31% |
| Philadelphia | 44.9 | 6% | 75% |
| NYC | 44.7 | 3% | 67% |
| Houston | 39.0 | 2% | 52% |
| San Jose | 35.8 | 4% | 4% |
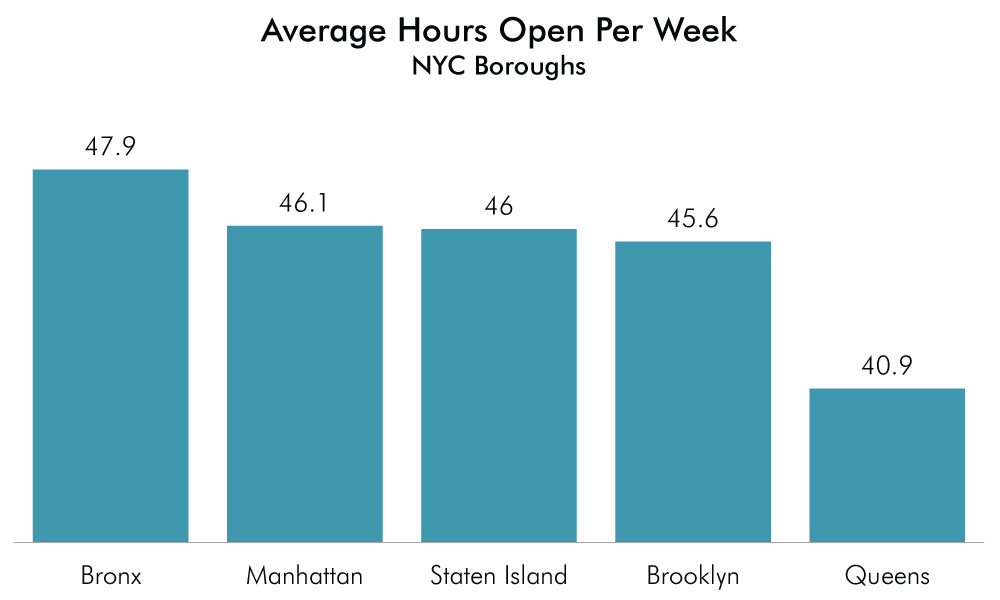
| Library Service Hours by NYC Borough |
|---|
| County | Avg Hours Open per Week | Branches open 7 days | Branches open at least 6 days |
| Bronx | 47.9 | 3% | 97% |
| Manhattan | 46.1 | 3% | 97% |
| Staten Island | 46 | 8% | 92% |
| Brooklyn | 45.6 | 3% | 64% |
| Queens | 40.9 | 3% | 29% |
Source: This data is from an assessment of posted library hours that we conducted in November 2014-March of 2015.


