Data - May 2015
The Next 10 Years: Mayor de Blasio’s Capital PrioritiesIn this data brief, we compare Mayor de Blasio’s 10-year capital projections to actual capital expenditures in the final decade of the Bloomberg Administration (FY2005-FY2014). The numbers offer a clear insight into Mayor de Blasio’s priorities and how they contrast with the previous administration’s.
Data - April 2015
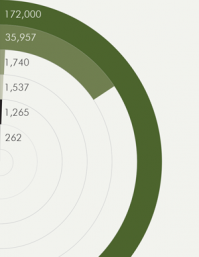
Library Funding is Behind the TimesThough visits, book circulation and program attendance are on the rise, New York City’s public libraries are open fewer hours than the state’s largest counties and trail behind cities throughout the nation.
Data - March 2015
Aging Gas Lines: Signs of Progress, But Improvements Still NeededThe recent tragedy in the East Village brought renewed attention to the city’s infrastructure. And while aging gas mains and service lines remain an issue, both Con Edison and National Grid have significantly improved the safety and efficiency of the distribution system in recent years.
Data - March 2015
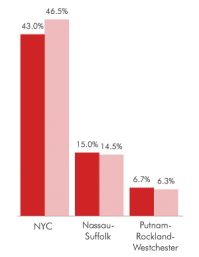
NYC’s Share of Private Sector JobsThough jobs have grown in nearly every region of the state over the last decade, New York City’s share of the state’s private sector jobs has skyrocketed – growing from 43.0 percent in 2004 to 46.5 percent in 2014.
Data - January 2015
New York State’s Language BarrierNearly every corner of New York State is experiencing a spike in immigrants—with the fastest growth occurring upstate—but funding for ESOL classes has not kept pace.
Data - November 2014
NYC’s Growing Self-Employed PopulationNew York City is now home to nearly a quarter million self-employed workers, and this segment of the workforce increased by 31 percent between 2000 and 2012. As of 2012, 6.5 percent of the city’s working adults were self-employed, up from 5.7 percent in 2000.
Data - September 2014
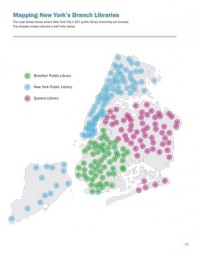
Data from Re-Envisioning New York’s Branch LibrariesCharts and tables from our Re-Envsioning New York's Branch Libraries report which found that while more New Yorkers than ever are using the city’s public libraries, a significant share of the branches suffer from major physical defects and are poorly configured for how New Yorkers are using libraries today. The report provides a comprehensive blueprint for bringing these vital community institutions into the 21st Century.
Data - September 2014
Data from Bridging the DisconnectCharts and tables from our Bridging the Disconnect report which found that while New York City is facing a youth unemployment crisis, the city’s youth workforce development programs reach only a fraction of those in need of help and are too often misaligned to the developmental needs of young New Yorkers.
Data - May 2014
New York’s Design EconomyAs New York City opens its second annual design week, this data analysis documents the continued economic importance of New York City’s design sector. It shows that New York has 65 percent more designers than any other metro area in the U.S., and that employment at city design firms increased by nearly 10 percent since the 2008 recession.
Data - March 2014
The Start of a NYC Manufacturing Revival?This data analysis shows that New York City's manufacturing sector is finally showing signs of strength. The city lost at least 5,000 manufacturing jobs every year from 1997 to 2010, but over the past three years employment in the sector has held steady, with job totals in 2013 the same as in 2010.
Data - March 2014
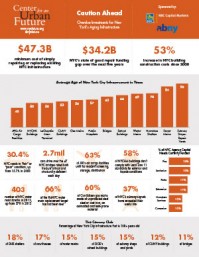
Data from Caution AheadCharts and tables from our Caution Ahead report which found that while Superstorm Sandy focused much-needed attention on key pieces of New York City’s infrastructure, the city faces a number of other infrastructure vulnerabilities that have little to do with storm-preparedness—from aging water mains and deteriorating roads to crumbling public schools. If left unchecked, they could wreak havoc on the city’s economy and quality of life.
Data - December 2013
NYS Regional Economic Development Council Awards by Region, 2011-2013NYC has received just 7.8 percent of the state’s Regional Economic Development Council (REDC) grants over the past three years, despite having more than 40 percent of the state’s population and businesses—and being home to the two counties with the highest unemployment rates in the state.
Data - July 2013
Data from The New Face of New York’s SeniorsSelected charts and tables from the Center for an Urban Future's 2013 report The New Face of New York's Seniors. The report found that New Yorkers are getting older and almost half of the city’s older adults are immigrants; but while the city has taken initial steps to plan for this rapidly diversifying population, not nearly enough attention has been paid to this particularly vulnerable subset of the city’s seniors.
Data - July 2013
More than ManhattanManhattan remains the epicenter of New York City’s economy, but the other four boroughs now comprise roughly 40 percent of all private sector jobs in the city, their highest total ever. In 2012, Manhattan accounted for 60.50 percent of the city’s private sector jobs, down from 65.92 percent in 1982 and 63.08 percent as recently as 2000.
Data - June 2013
Still Waiting for NYC’s Biotech BoomNew York City has all the ingredients to become a leading biotech hub, and the Bloomberg administration is pulling out all the stops to support the sector’s growth; but the New York Metro region was only fifth among all regions in biotech VC deals last quarter—and all of the local deals went to companies in New Jersey and Connecticut.
Data - June 2013
Data from Completion DaySelected charts and graphs from the Center for an Urban Future's 2013 report Completion Day. The report found that community colleges are a critical resource for a growing number of New Yorkers and a key component of the state's economic competitiveness but are taken for granted by policymakers and continue to face enormous challenges in graduating students.
Data - May 2013
Seeding NYC’s Startup SuccessOver the past decade, the NYC region’s share of all venture capital deals in the U.S. more than doubled, from 5.3 percent to 11.4 percent. During the same period, New England’s share fell from 14.8 percent to 10.2 percent and Silicon Valley’s rose slightly, from 28.6 percent to 31.7 percent.
Data - April 2013
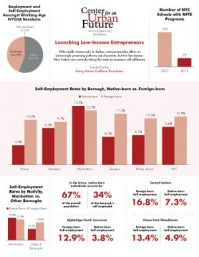
Data from Launching Low-Income EntrepreneursSelected charts and graphs from the Center for an Urban Future's major April 2013 report on low-income entrepreneurs. The report found that with middle-income jobs in decline, entrepreneurship offers an increasingly promising pathway out of poverty; but few low-income New Yorkers are currently taking this route to economic self-sufficiency.
Data - April 2013
Low-Wage Jobs, 2012Over the past five years, the number of New Yorkers who work in low-wage jobs has steadily increased, with more than a third of adults in the city—and nearly half in the Bronx—now stuck in low-paying occupations.
Data - March 2013
Is Manufacturing Back in Brooklyn?Like the rest of New York City, Brooklyn has been bleeding manufacturing jobs for decades. But in the last few years, manufacturing employment in the borough is up slightly, even though the average company now has considerably fewer employees on average. Is Brooklyn in a new age of entrepreneurial manufacturing?


