Last week, Mayor de Blasio released his 10-Year Capital Strategy. While these spending goals are not binding1, the document presents an ambitious capital strategy and offers a clear insight into the administration’s priorities and how they contrast with how the previous administration spent city capital dollars over the past decade. In this data brief, Mayor de Blasio’s 10-year projections are compared to actual capital expenditures in the final ten fiscal years of the Bloomberg Administration (FY2005-FY2014), adjusted for inflation.
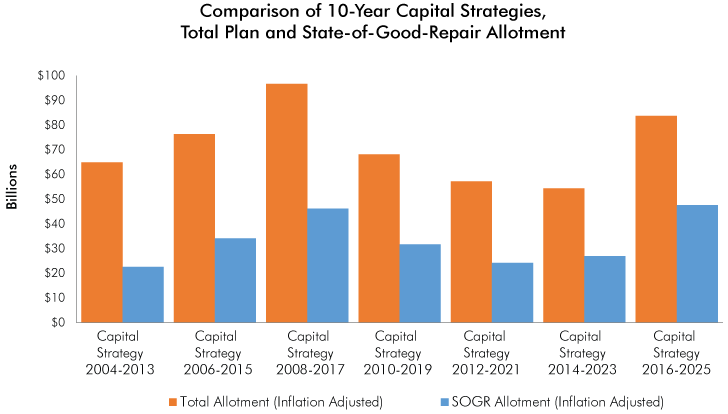
The 10-Year Capital Strategy, which is prepared every two years, presents the long-term capital spending goals for each city agency. Arriving just one month after the release of its comprehensive long-term plan, OneNYC, the current 10-Year Capital Strategy offers a particularly robust and important insight into the mayor’s priorities. Comparing the current document to the previous six 10-Year Capital Strategies, Mayor de Blasio’s plan allots more capital dollars than all but the FY2008-2017 Plan (a similarly robust document that followed the original PlaNYC) and devotes by far the largest share to State of Good Repair needs (57 percent).
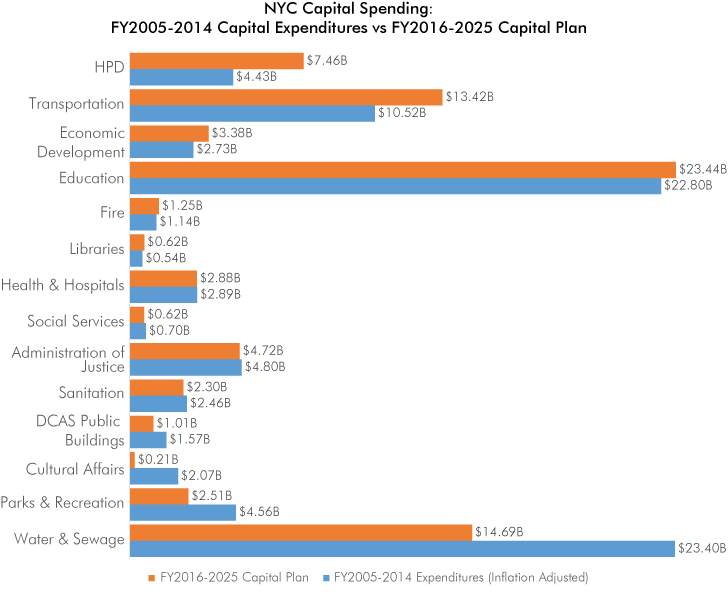
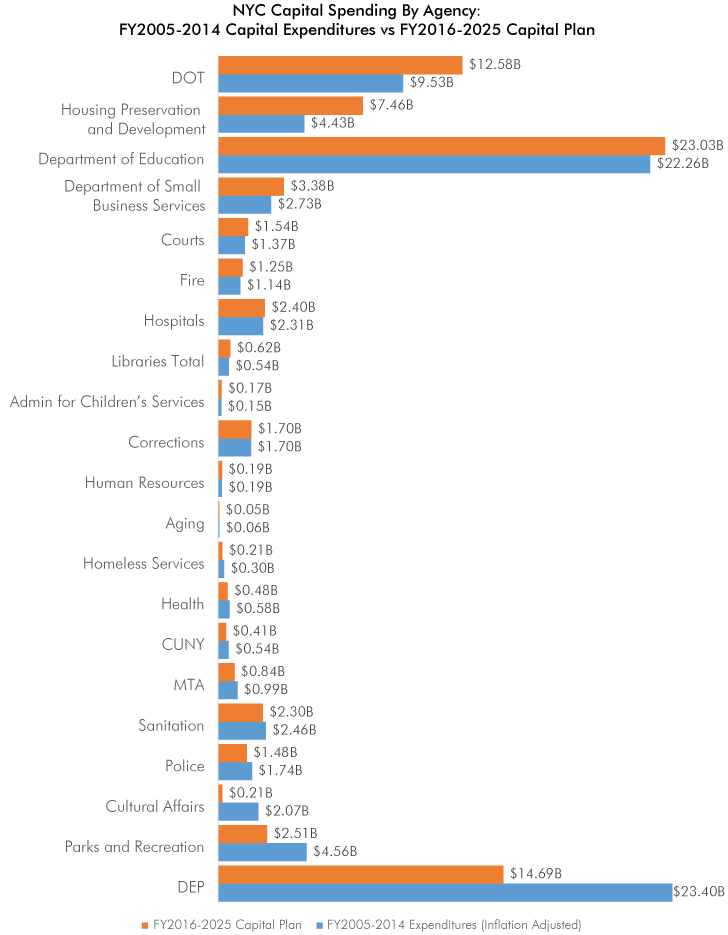
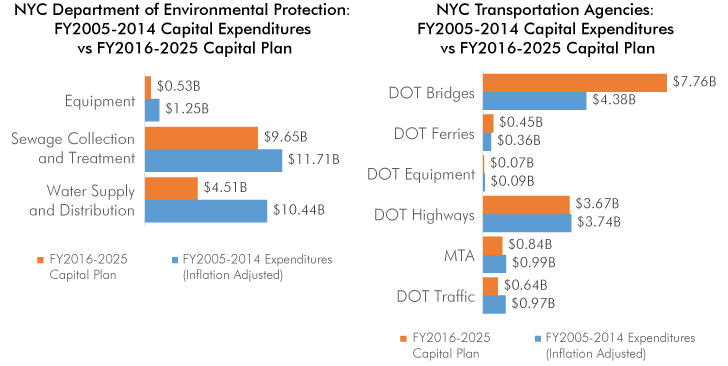
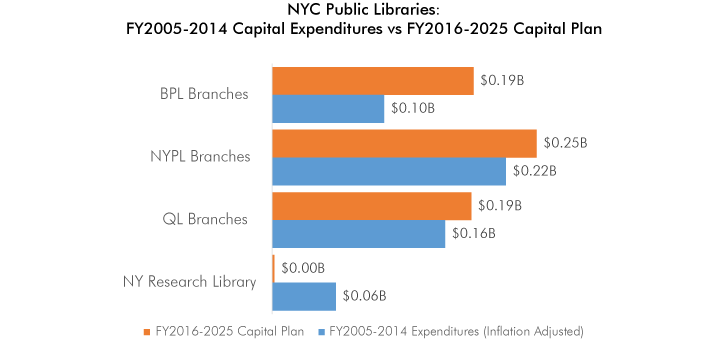
Comparing the spending goals of the current Capital Strategy to actual capital expenditures over the last decade is also a useful exercise, demonstrating changing priorities between administrations. As expected, Mayor de Blasio plans to devote significantly more capital dollars to housing, with the Department of Housing Preservation and Development allotted $7.5 billion in the 10-Year Strategy compared to $4.4 billion actually spent by the city from FY2005-FY2014, a 68 percent increase. Meanwhile, the city’s Department of Transportation (DOT) is projected to receive 32 percent more capital funding than it did in Mayor Bloomberg’s final decade in office ($12.6 billion versus $9.5 billion), with the lion share of that bump devoted to bridges ($7.8 billion versus $4.4 billion). Other notable projected increases include 24 percent more funding for the Department of Small Businesses ($3.4 billion versus $2.7 billion) and 15 percent more for the city’s libraries ($623 million versus $544 million), as well as a special outlay for the New York City Housing Authority ($899 million).
The 10-Year Capital Strategy also projects significant reductions in capital spending for some agencies in comparison to the final ten years of capital expenditures during the Bloomberg administration. Following a decade of historic outlays for the Department of Parks and Recreation, including major developments along the Brooklyn, Queens and Manhattan waterfronts, capital spending is projected to fall by 45 percent over the next decade (from $4.6billion to $2.5billion). Projected capital allocations are also lower for public buildings maintained by the city’s Department of Citywide Administrative Services (from $1.6 billion to $1 billion) and CUNY’s senior and community colleges (from $539 million to $406 million).
At the Department of Environmental Protection, capital funding is projected to fall by 37 percent (from $23.4 billion to $14.7 billion). Over the last decade, federal mandates to improve the quality of the city’s drinking water and reduce Combined Sewage Overflow into its harbor necessitated major capital investments—including the construction of the Croton Water Filtration Plant and the Catskill-Delaware Water Ultraviolet Disinfection Facility as well as major upgrades to the Newtown Creek Wastewater Treatment Plant. With these projects nearly completed, a reduction in capital spending over the next decade should not be surprising. In one notable reversal, however, funding for the construction of the Brooklyn-Queens section of Water Tunnel No. 3 appears to be deferred2. In addition to increasing the conveyance capacity of the city’s water supply, the construction of Tunnel No. 3 will allow Water Tunnel No. 1 (completed in 1917) and No. 2 (1935) to be inspected for the first time since they began operating.
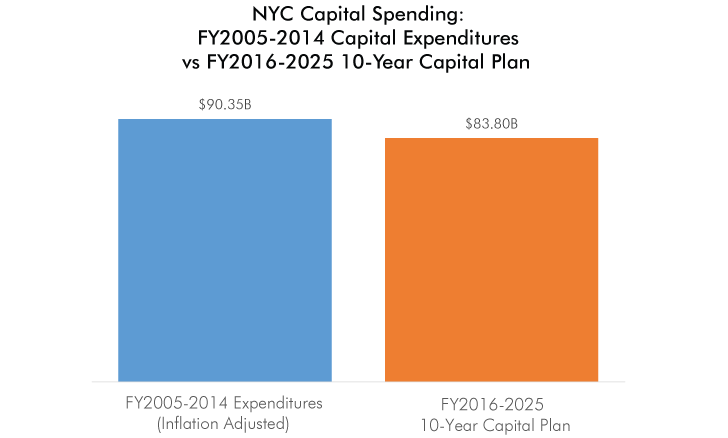
In total, city capital spending is projected to fall by 7 percent (from $90.3 billion to $83.8 billion), when comparing Mayor de Blasio’s 10-Year strategy to actual capital expenditures in the final decade of the Bloomberg Administration. While the administration deserves credit for increasing capital spending in a number of important areas, it should be making a larger overall capital investment at a time when so much of New York City’s infrastructure is aging and in need of repair. Last year, the Center published a report which documented that a significant portion of New York City’s essential infrastructure is more than 50 years old and badly in need of repair. It calculated that $47 billion is needed over the next four to five years simply to bring the city’s aging infrastructure to a state of good repair.
1 Unforeseen needs and city council discretionary allocations will certainly influence and alter future capital expenditures. Capital commitments to be rolled over from FY2015 are also not included.
2 AECOM. “The New York City Municipal Water Finance Authority Fiscal Year 2015 Consulting Engineer’s Report.” March 1, 2015. Page 16. http://www.nyc.gov/html/nyw/pdf/fy2015_consulting_engineers.pdf
Source: data are from the Ten-Year Capital Strategy, Fiscal Years 2016-2025 (PDF), NYC Capital Expenditures, FY05-FY14, and the Bureau of Labor Statistics' Inflation Adjustment Calculator.