|
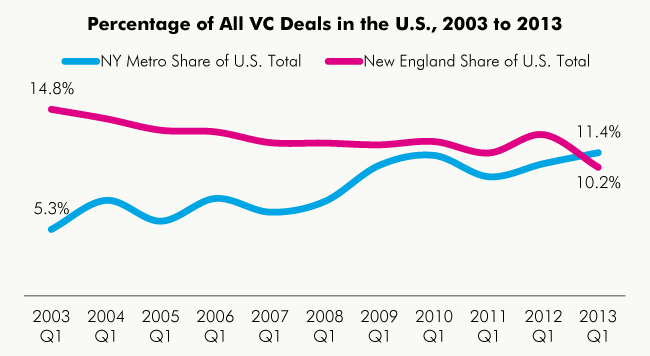
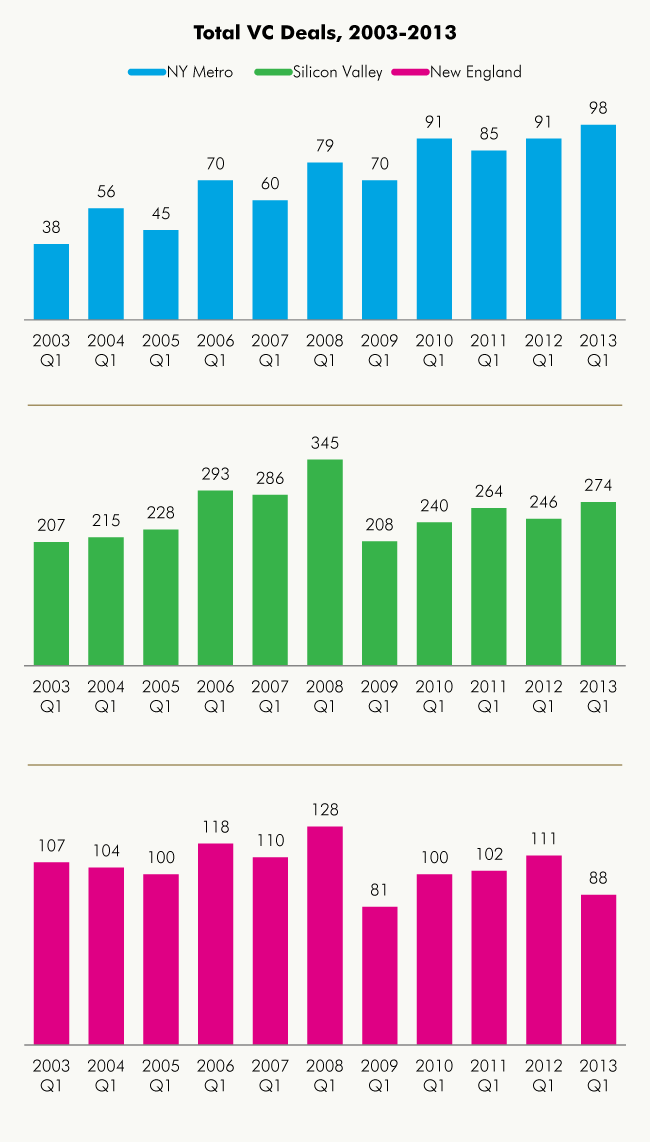
Percentage of All VC Deals in the U.S., 2003 to 2013 |
|---|
|
|
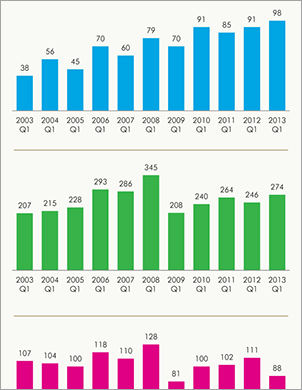
Total VC deals in U.S. |
NY Metro Total Deals |
NY Metro Share of U.S. Total |
Silicon Valley Total Deals |
Silicon Valley Share of U.S. Total |
New England Total Deals |
New England Share of U.S. Total |
|
2003 Q1 |
723 |
38 |
5.3% |
207 |
28.6% |
107 |
14.8% |
|
2004 Q1 |
740 |
56 |
7.6% |
215 |
29.1% |
104 |
14.1% |
|
2005 Q1 |
761 |
45 |
5.9% |
228 |
30.0% |
100 |
13.1% |
|
2006 Q1 |
907 |
70 |
7.7% |
293 |
32.3% |
118 |
13.0% |
|
2007 Q1 |
905 |
60 |
6.6% |
286 |
31.6% |
110 |
12.2% |
|
2008 Q1 |
1056 |
79 |
7.5% |
345 |
32.7% |
128 |
12.1% |
|
2009 Q1 |
676 |
70 |
10.4% |
208 |
30.8% |
81 |
12.0% |
|
2010 Q1 |
817 |
91 |
11.1% |
240 |
29.4% |
100 |
12.2% |
|
2011 Q1 |
900 |
85 |
9.4% |
264 |
29.3% |
102 |
11.3% |
|
2012 Q1 |
868 |
91 |
10.5% |
246 |
28.3% |
111 |
12.8% |
|
2013 Q1 |
863 |
98 |
11.4% |
274 |
31.7% |
88 |
10.2% |
Source: Center for an Urban Future analysis of data from MoneyTree Report, published by PricewaterhouseCoopers and the National Venture Capital Association with data from Thomson Reuters
