As lawmakers in Albany negotiate a new budget that will have profound impacts on both the state and local economies, they should be cognizant of the state’s long-term economic trends. Though jobs have grown in nearly every region of the state over the last decade, New York City has become more important than ever to the state’s economy.
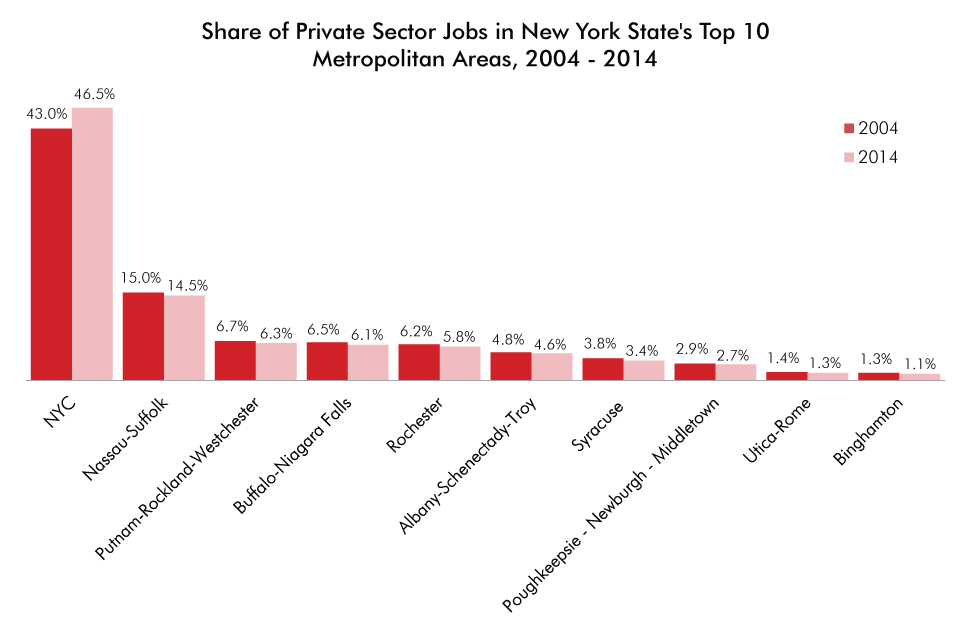
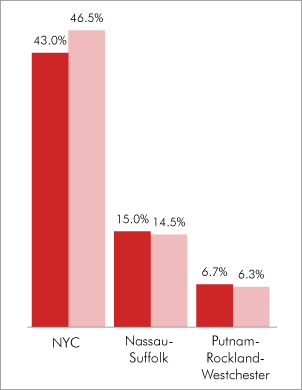
New York City’s share of the state’s private sector job total has spiked from 43.0 percent in 2004 to 46.5 percent in 2014.1 Every other major metropolitan area in the state experienced a decline in their share of the state’s jobs during the same period, with the biggest drops occurring in Buffalo/Niagara Falls (whose share of state jobs fell from 6.5 percent in 2004 to 6.1 percent in 2014) and Long Island (from 15.0 percent to 14.5 percent). Other regions experiencing a drop include Rochester (from 6.2 percent to 5.8 percent), Syracuse (from 3.8 percent to 3.4 percent), Binghamton (1.3 percent to 1.1 percent), Albany/Schenectady/Troy (4.8 percent to 4.6 percent), Putnam/Rockland/Westchester (6.7 percent to 6.3 percent), Poughkeepsie /Newburgh/Middletown (from 2.9 percent to 2.7 percent) and Utica/Rome (1.4 percent to 1.3 percent).
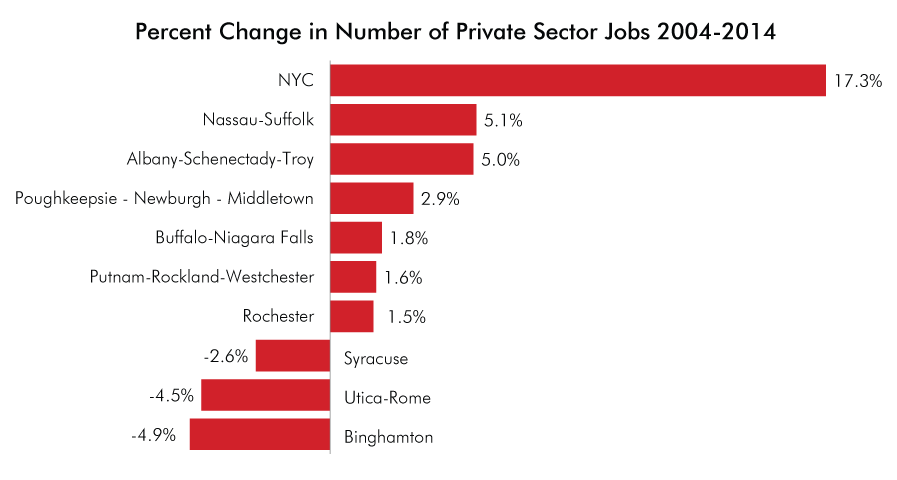
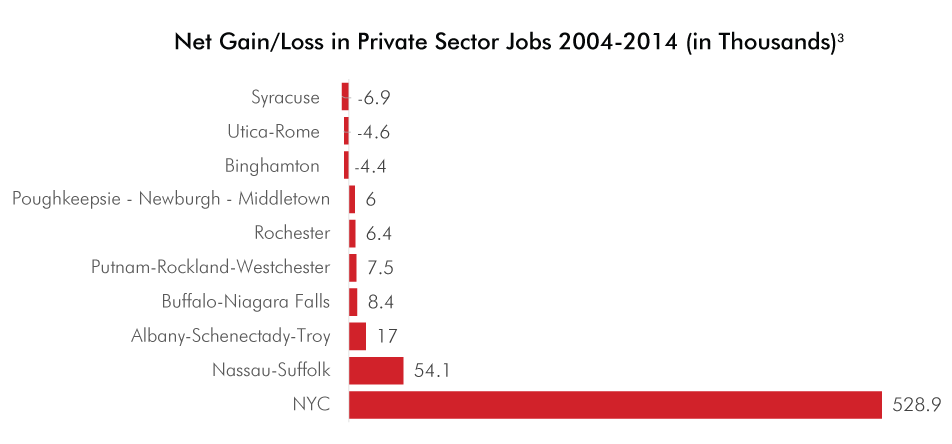
Overall, private sector jobs in New York City increased by 17.3 percent over the past decade, from 3,051,200 in 2004 to 3,580,100 in 2014. Only Long Island had more than a 5 percent gain in private sector jobs during this period, adding jobs at a 5.1 percent clip. Three regions actually experienced a decline in private sector jobs from 2004 to 2014: Binghamton (with a 4.9 percent decrease in private sector jobs), Utica/Rome (with a 4.5 percent drop) and Syracuse (with a 2.6 percent drop).
New York City’s economic impact is disproportionate to its population. While New York City now accounts for 46.5 percent of the state’s private sector jobs, the five boroughs currently comprise just 42.4 percent of the state’s population.2


Source: NY State Department of Labor. Figures are from November 2004 to November 2014.
1 Analysis using data from NY State Department of Labor. Figures are from November 2004 to November 2014.
2 US Census, American Community Survey, 5-Year Estimates, 2013.
3 The graph "Net Gain/Loss in Private Sector Jobs 2004-2014" was updated at 12:30pm, March 19, 2014


