logo
Data from Completion Day

Data - June 2013

Data from Completion Day

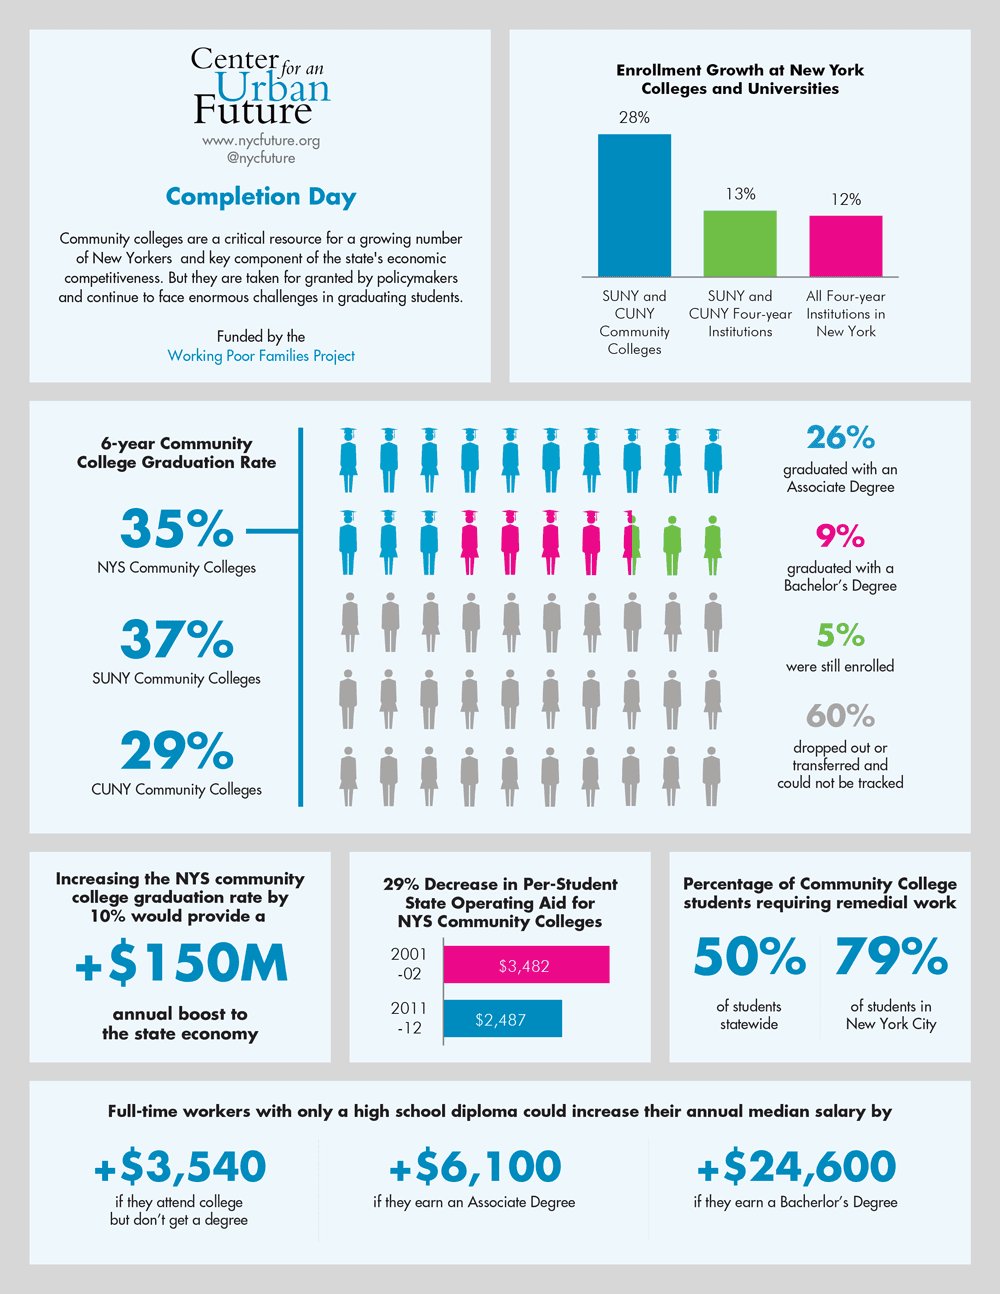
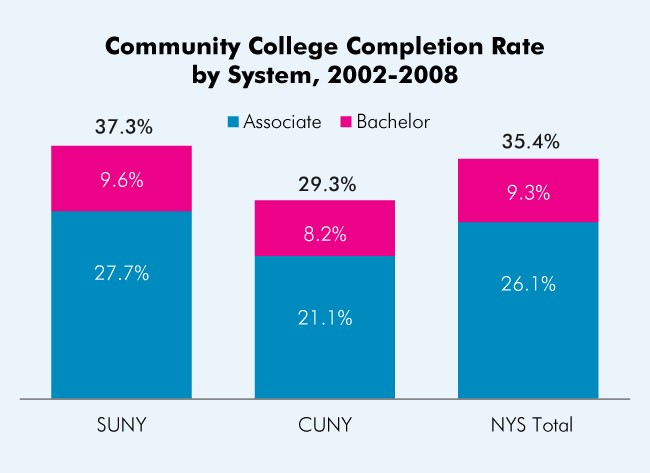
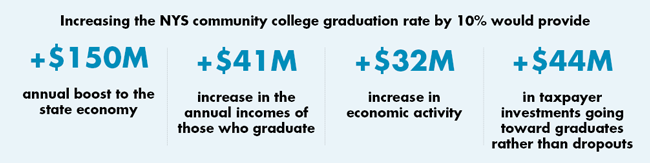
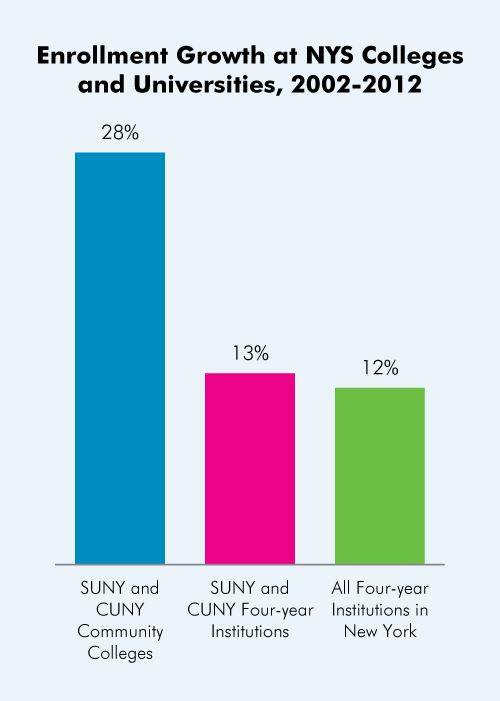
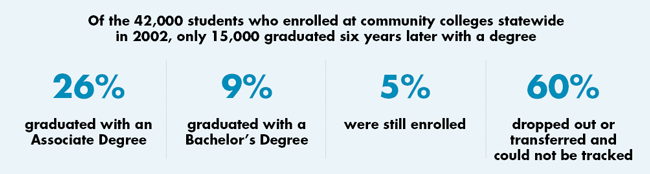
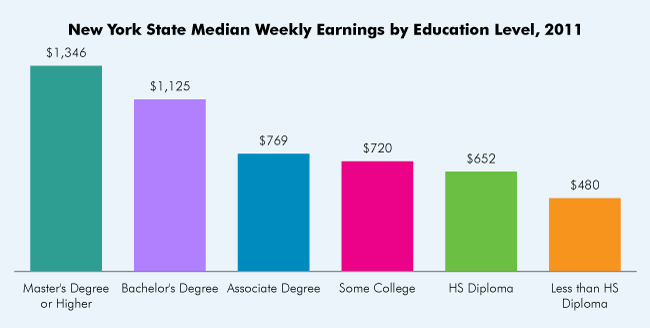
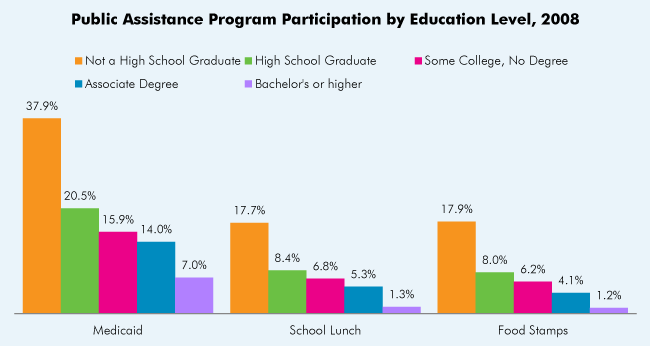
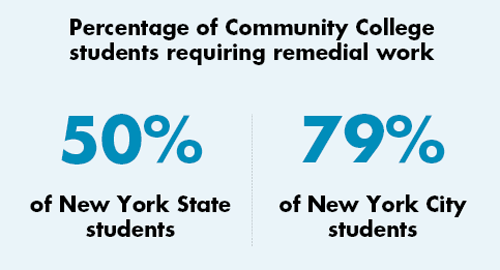
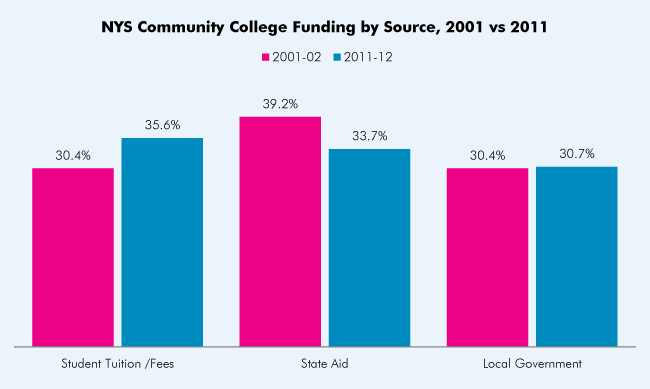
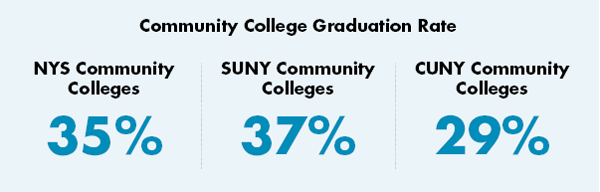
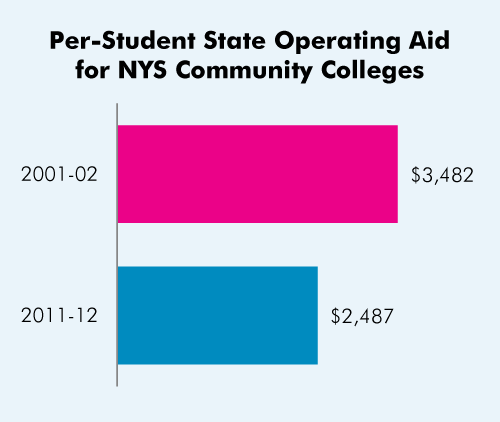
Selected charts and graphs from the Center for an Urban Future's 2013 report Completion Day. The report found that community colleges are a critical resource for a growing number of New Yorkers and a key component of the state's economic competitiveness but are taken for granted by policymakers and continue to face enormous challenges in graduating students.

Tags: economic opportunity higher education community colleges human capital


Table 1: NYS Community Colleges with the Highest and Lowest Graduation Rates
  Avg Grad Rate Avg Pop Avg Low-Income Avg Minority Avg Remedial Avg Adult
Top 5 schools
by graduation rate
45% 722 38% 19% 52% 33%
Bottom 5 schools
by graduation rate
24% 1,248 54% 80% 65% 39%


Table 2: 6-year Graduation Rates for New York State’s 35 Community Colleges
College Cohort Entered Fall 2002 All Degrees Associate Degrees Bachelor's Degrees
Community Colleges 42,045 14,902 10,990 3,912
Jefferson (SUNY) 592 46% 29% 17%
Niagara County (SUNY) 913 45% 33% 13%
Finger Lakes (SUNY) 790 44% 34% 10%
Jamestown (SUNY) 779 44% 29% 15%
Cayuga County (SUNY) 536 43% 34% 10%
Columbia-Greene (SUNY) 215 43% 34% 8%
Broome (SUNY) 1,330 42% 25% 17%
Fulton-Montgomery (SUNY) 427 42% 30% 13%
Monroe (SUNY) 2,733 42% 31% 11%
North Country (SUNY) 272 41% 32% 9%
Herkimer County (SUNY) 819 40% 30% 10%
Adirondack (SUNY) 662 39% 28% 11%
Clinton (SUNY) 336 39% 26% 12%
Hudson Valley (SUNY) 2,364 39% 29% 10%
Kingsborough (CUNY) 1,776 39% 28% 10%
Erie (SUNY) 2,140 38% 27% 11%
Mohawk Valley (SUNY) 1,320 37% 25% 13%
Nassau (SUNY) 4,042 37% 30% 7%
Dutchess (SUNY) 940 36% 26% 10%
Genesee (SUNY) 595 36% 25% 10%
Corning (SUNY) 645 35% 29% 7%
Tompkins Cortland (SUNY) 584 35% 24% 11%
Onondaga (SUNY) 963 34% 24% 11%
Rockland (SUNY) 1,069 34% 25% 9%
Schenectady County (SUNY) 403 34% 29% 5%
Suffolk County (SUNY) 3,385 34% 27% 6%
Ulster County (SUNY) 443 33% 21% 12%
Queensborough (CUNY) 1,833 30% 19% 11%
LaGuardia (CUNY) 1,902 29% 21% 8%
Orange County (SUNY) 995 28% 21% 7%
Borough of Manhattan (CUNY) 2,775 27% 20% 7%
Westchester (SUNY) 1,493 27% 22% 4%
Bronx (CUNY) 976 24% 18% 5%
Sullivan County (SUNY) 428 23% 18% 6%
Hostos (CUNY) 570 21% 18% 3%
All Community Colleges 100% 35% 26% 9%


Table 3: Enrollment by Race, Residency and Income Status, Fall 2010
Institution Minority White, Non-Hispanic Nonresident Alien Low-income Full-Time Part-Time
All Community Colleges 37% 63% 2% 39% 57% 43%
Adirondack (SUNY) 7% 93% 0% 33% 57% 43%
Borough of Manhattan (CUNY) 88% 12% 7% 60% 59% 41%
Bronx (CUNY) 97% 3% 4% 71% 56% 44%
Broome (SUNY) 32% 68% 2% 33% 71% 29%
Cayuga County (SUNY) 29% 71% 0% 38% 54% 46%
Clinton (SUNY) 22% 78% 1% 36% 58% 42%
Columbia-Greene (SUNY) 16% 84% 0% 38% 50% 50%
Corning (SUNY) 24% 76% 0% 35% 47% 53%
Dutchess (SUNY) 35% 65% 1% 20% 49% 51%
Erie (SUNY) 29% 71% 1% 41% 66% 34%
Finger Lakes (SUNY) 21% 79% 0% 37% 56% 44%
Fulton-Montgomery (SUNY) 25% 75% 4% 45% 64% 36%
Genesee (SUNY) 22% 78% 1% 40% 50% 50%
Herkimer County (SUNY) 26% 74% 2% 46% 67% 33%
Hostos (CUNY) 96% 4% 7% 63% 65% 35%
Hudson Valley (SUNY) 23% 77% 0% 26% 56% 44%
Jamestown (SUNY) 12% 88% 0% 49% 54% 46%
Jefferson (SUNY) 19% 81% 0% 40% 59% 41%
Kingsborough (CUNY) 65% 35% 3% 42% 57% 43%
LaGuardia (CUNY) 86% 14% 12% 42% 58% 42%
Mohawk Valley (SUNY) 21% 79% 1% 46% 64% 36%
Monroe (SUNY) 33% 67% 1% 42% 62% 38%
Nassau (SUNY) 54% 46% 2% 28% 63% 37%
Niagara County (SUNY) 17% 83% 0% 36% 61% 39%
North Country (SUNY) 8% 92% 1% 31% 46% 54%
Onondaga (SUNY) 27% 73% 0% 29% 53% 47%
Orange County (SUNY) 37% 63% 0% 21% 50% 50%
Queensborough (CUNY) 78% 22% 7% 42% 57% 43%
Rockland (SUNY) 58% 42% 1% 27% 59% 41%
Schenectady County (SUNY) 22% 78% 0% 32% 39% 61%
Suffolk County (SUNY) 37% 63% 1% 28% 56% 44%
Sullivan County (SUNY) 50% 50% 0% 49% 67% 33%
Tompkins Cortland (SUNY) 18% 82% 2% 47% 52% 48%
Ulster County (SUNY) 16% 84% 1% 25% 45% 55%
Westchester (SUNY) 56% 44% 1% 31% 54% 46%


Table 4: Changes in Per-Student Funding to NYS Community Colleges, 2001 vs 2011
Funding Sources 2001-02 2011-12 Change
Student Tuition/Fees $3,336 $3,584 7%
State Operating Aid $3,482 $2,487 -29%
State TAP/APTS $818 $910 11%
Local Government $3,336 $3,093 -7%
Total Funding $10,972 $10,074 -8%


Table 5: SUNY Student Success Initiatives
Programs for enrolled college students Number ofcolleges
Learning communities 8
Supplemental instruction 10
Contextualized instruction 19
Academic support centers 30
Technology enhancements 15
Other 17