Self-Employment by ZIP Code
Click the buttons below to see data for each of New York City's five boroughs. Darker colors indicate higher self-employment rates.
Interactive map created by Cesar Bustamante
Self-Employment Rates in New York City’s 55 Census-Defined Neighborhoods
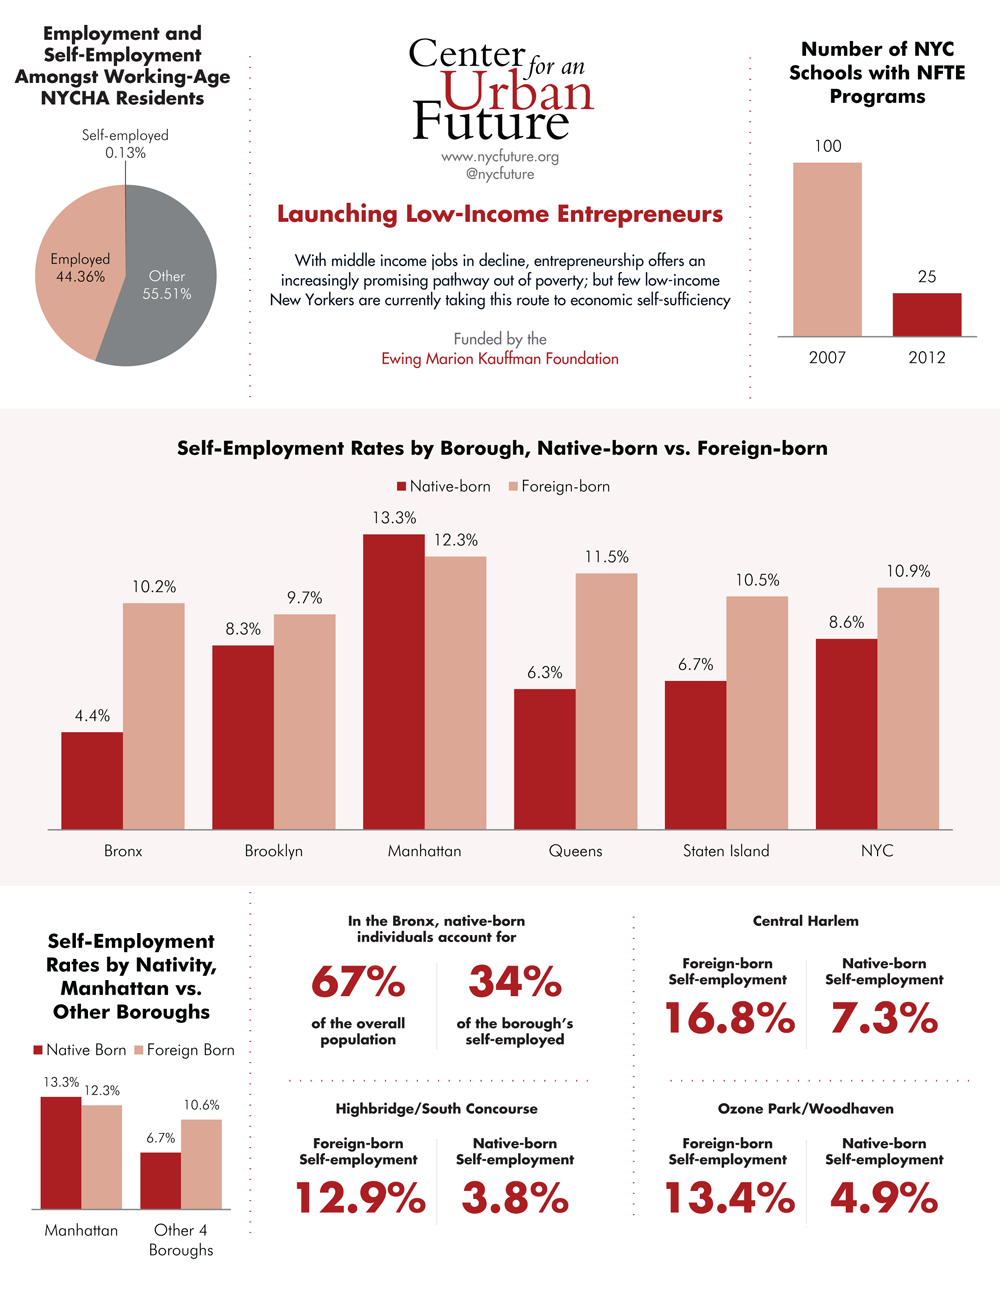
Neighborhoods with the lowest self-employment rates are predominantly low-income and native-born, while those in the middle range are still low-income but with much higher percentages of foreign-born residents.
|
Bottom Third: Neighborhoods with Lowest Self Employment Rates |
|---|
|
Neighborhood |
% self employed |
Median income for persons 15+ years (2010) |
% of population that is foreign-born |
|
East New York/Starrett City |
3.9% |
$20,572 |
33.6% |
|
Brownsville/Ocean Hill |
4.0% |
$19,939 |
27.9% |
|
Throgs Neck/Co-op City |
4.3% |
$31,441 |
18.9% |
|
Williamsbridge/Baychester |
4.8% |
$27,524 |
38.4% |
|
East Harlem |
4.8% |
$19,153 |
25.4% |
|
Soundview/Parkchester |
5.6% |
$22,698 |
29.8% |
|
East Flatbush |
5.8% |
$26,705 |
53.0% |
|
North Shore |
6.2% |
$30,513 |
24.6% |
|
Jamaica |
6.5% |
$25,958 |
40.0% |
|
Mott Haven/Hunts Point |
6.8% |
$13,022 |
28.7% |
|
Queens Village |
6.9% |
$33,032 |
42.0% |
|
Rockaways |
7.0% |
$25,240 |
27.2% |
|
Flatlands/Canarsie |
7.1% |
$32,873 |
41.0% |
|
Pelham Parkway |
7.1% |
$27,086 |
35.0% |
|
Morrisania/Belmont |
7.2% |
$13,741 |
28.1% |
|
South Shore |
7.2% |
$41,180 |
14.3% |
|
Coney Island |
7.3% |
$20,582 |
51.3% |
|
Bedford Stuyvesant |
7.4% |
$21,441 |
20.1% |
|
Average |
6.1% |
$25,150 |
32.2% |
|
Middle Third: Neighborhoods with Middle Range of Self-Employment Rates |
|---|
|
Neighborhood |
% self employed |
Median income for persons 15+ years (2010) |
% of population that is foreign-born |
|
Bushwick |
7.4% |
$18,432 |
37.2% |
|
Washington Heights/Inwood |
7.8% |
$19,201 |
49.4% |
|
South Crown Heights |
7.9% |
$24,036 |
45.4% |
|
South Ozone Park/Howard Beach |
7.9% |
$27,083 |
46.5% |
|
North Crown Heights/Prospect Heights |
8.1% |
$27,357 |
30.9% |
|
Kingsbridge Heights/Mosholu |
8.1% |
$18,319 |
40.5% |
|
Middle Village/Ridgewood |
8.2% |
$28,592 |
37.4% |
|
Highbridge/South Concourse |
8.8% |
$16,001 |
39.4% |
|
Riverdale/Kingsbridge |
8.9% |
$31,599 |
32.0% |
|
Bensonhurst |
9.0% |
$21,870 |
52.9% |
|
Sunset Park |
9.1% |
$21,286 |
46.8% |
|
Elmhurst/Corona |
9.3% |
$22,384 |
66.9% |
|
University Heights/Fordham |
9.3% |
$14,811 |
40.4% |
|
Sunnyside/Woodside |
9.4% |
$28,700 |
58.5% |
|
Bay Ridge |
9.4% |
$30,048 |
37.1% |
|
Jackson Heights |
9.6% |
$22,916 |
63.4% |
|
Astoria |
9.7% |
$28,479 |
43.7% |
|
Flatbush |
9.8% |
$25,817 |
45.8% |
|
Average |
8.8% |
$23,718 |
45.2% |
|
Top Third: Neighborhoods with Highest Self-Employment Rates |
|---|
|
Neighborhood |
% self employed |
Median income for persons 15+ years (2010) |
% of population that is foreign-born |
|
Sheepshead Bay/Gravesend |
10.0% |
$26,925 |
45.7% |
|
Central Harlem |
10.1% |
$23,621 |
22.1% |
|
Mid-Island |
10.1% |
$34,466 |
25.4% |
|
Ozone Park/Woodhaven |
10.1% |
$27,531 |
49.9% |
|
Hillcrest/Fresh Meadows |
10.8% |
$30,236 |
46.4% |
|
Rego Park/Forest Hills |
10.9% |
$39,867 |
51.3% |
|
Morningside Heights/Hamilton Heights |
10.9% |
$22,389 |
34.7% |
|
Williamsburg/Greenpoint |
11.4% |
$24,655 |
24.9% |
|
Flushing/Whitestone |
11.7% |
$27,695 |
54.7% |
|
Borough Park |
11.9% |
$21,329 |
34.3% |
|
Lower East Side/Chinatown |
12.1% |
$24,839 |
35.6% |
|
Brooklyn Heights/Fort Greene |
12.3% |
$40,540 |
18.9% |
|
Stuyvesant Town/Turtle-Bay |
13.4% |
$63,499 |
23.5% |
|
Bayside/Little Neck |
13.5% |
$36,422 |
41.3% |
|
Upper East Side |
13.7% |
$70,675 |
21.4% |
|
Chelsea/Clinton/Midtown |
14.8% |
$51,129 |
25.8% |
|
Park Slope/Carroll Gardens |
16.1% |
$47,011 |
17.2% |
|
Greenwich Village/Financial District |
17.9% |
$60,680 |
23.1% |
|
Upper West Side |
18.3% |
$59,584 |
21.2% |
|
Average |
12.6% |
$38,583 |
32.5% |
Source: 2007-2011 American Community Survey
Establishments per Capita in NYC’s 50 Poorest ZIP Codes
Low-income ZIP codes with high foreign born populations have significantly more local businesses.
|
ZIP Codes with Fewest Establishments per Capita |
|---|
|
ZIP Code |
Neighborhood |
Number of Establishments |
Population |
Establishments / capita (%) |
Population that is foreign-born (%) |
Median Individual Income |
|
11692 |
Arverne |
90 |
18,540 |
0.5% |
25.72% |
$21,176 |
|
11233 |
Stuyvesant Heights |
364 |
67,053 |
0.5% |
24.2% |
$24,008 |
|
11239 |
Starett City |
76 |
13,393 |
0.6% |
30.06% |
$16,328 |
|
10456 |
Morrisania |
581 |
86,547 |
0.7% |
32.03% |
$13,351 |
|
11221 |
Bushwick / Bedford-Stuyvesant |
566 |
78,895 |
0.7% |
26.56% |
$20,667 |
|
10039 |
Central Harlem, North |
183 |
24,527 |
0.7% |
19.53% |
$19,210 |
|
10472 |
Soundview |
506 |
66,358 |
0.8% |
37.73% |
$17,621 |
|
11208 |
Cypress Hills |
745 |
94,469 |
0.8% |
35.46% |
$21,082 |
|
10453 |
Morris Heights |
630 |
78,309 |
0.8% |
39.08% |
$14,769 |
|
11691 |
Far Rockaway |
490 |
60,035 |
0.8% |
32.62% |
$19,940 |
|
Zip Codes with Most Establishments per Capita |
|---|
|
ZIP Code |
Neighborhood |
Number of Establishments |
Population |
Establishments / capita (%) |
Population that is foreign-born (%) |
Median Individual Income |
|
11355 |
Flushing / Murray Hill |
1,832 |
85,871 |
2.1% |
70.41% |
$21,999 |
|
11220 |
Sunset Park |
2,175 |
99,598 |
2.2% |
53.03% |
$18,721 |
|
11204 |
Parkville / Bensonhurst |
1,902 |
78,134 |
2.4% |
44.05% |
$21,281 |
|
11223 |
Gravesend / Homecrest |
1,948 |
78,731 |
2.5% |
45.4% |
$22,269 |
|
11219 |
Borough Park |
2,581 |
92,221 |
2.8% |
39.84% |
$18,870 |
|
11211 |
Williamsburg |
2,766 |
90,117 |
3.1% |
20.68% |
$22,408 |
|
10002 |
Chinatown / Lower East Side |
2,872 |
81,410 |
3.5% |
44.57% |
$20,103 |
|
11232 |
Industry City / Sunset Park |
1,174 |
28,265 |
4.2% |
45.51% |
$20,973 |
|
11354 |
Flushing / Murray Hill |
2,704 |
54,878 |
4.9% |
61.9% |
$23,920 |
|
10474 |
Hunts Point |
663 |
12,281 |
5.4% |
26.57% |
$13,928 |
Sources: 2010 Census. Census County Business Patterns 2010.