There are many reasons to celebrate New York City’s recent economic progress. During the Great Recession, the city shed fewer jobs, per capita, than the nation as a whole. The recovery has also been stronger in the five boroughs than in the rest of the state and in many of the nation’s other large cities. And the recent rise of the city’s tech sector has added much-needed balance to New York’s economy.
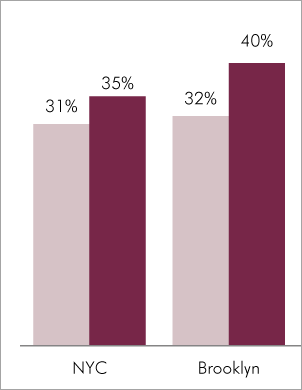
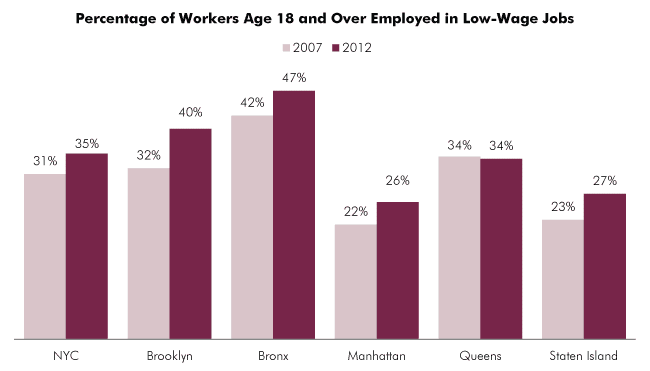
On the downside, however, a significant share of the city’s employment growth is occurring in low-paying occupations. As this analysis shows, the number of working New Yorkers who are stuck in low-wage jobs has risen steadily over the past five years. In 2012, 35.0 percent of New Yorkers over the age of 18 worked in a low-wage job, up from 31.1 percent in 2007. Even more alarming, nearly half of all adult workers in the Bronx and 40 percent in Brooklyn now work in low-wage jobs. While the numbers are slightly lower for the other three boroughs, at least a quarter of adult workers in every borough work in low-wage jobs.
Every borough but Queens registered an increase in the percentage of adults working in low-wage jobs, with Brooklyn experiencing the biggest jump. In the Bronx, 46.8 percent of employed adults now work in low-wage jobs, up from 42.1 percent in 2007. Between 2007 and 2012, the share of adults working in low-wage jobs rose from 32.2 percent to 39.6 percent in Brooklyn, from 22.5 percent to 27.4 percent on Staten Island and from 21.6 percent to 25.8 percent in Manhattan. In Queens, the share of adults working in low-wage jobs fell slightly, from 34.4 percent to 34.0 percent. Nationally, 28.2 percent of Americans worked in low-wage jobs in 2012.
The data, which is from the U.S. Population Reference Bureaui, defines a low-wage job in New York as one that pays less than $12.89 an hour meaning that they earn less than $26,818.06 annually.ii
The growth in the number of New Yorkers working in low-wage jobs likely reflects the increased polarization of New York City’s job market. A growing share of the decent-paying jobs being created in New York require at least a Bachelor’s degree. At the same time, professions that once provided an entry to the middle class for individuals with only a high school degree—including manufacturing, secretarial services and automobile maintenance—are now going to people with higher levels of educational attainment. One result is that workers with only a high school degree or less are increasingly competing for low-wage jobs in food service, retail, healthcare, security and other sectors.
|
|
No. of workers ages 18+ in low-wage jobs, 2012 |
No. of workers ages 18+, 2012 |
Pct. of workers ages 18+ in low-wage jobs, 2012 |
Pct. of workers ages 18+ in low-wage jobs, 2007 |
|---|
|
Brooklyn |
346,366 |
871,599 |
39.6% |
32.2% |
|
Bronx |
196,755 |
421,653 |
46.8% |
42.1% |
|
Manhattan |
190,876 |
734,918 |
25.8% |
21.6% |
|
Queens |
329,396 |
971,759 |
34.0% |
34.4% |
|
Staten Island |
46,927 |
170,552 |
27.4% |
22.5% |
|
New York City |
1,110,320 |
3,170,481 |
35.0% |
31.1% |
|
New York State |
2,586,222 |
7,680,476 |
33.7% |
30.5% |
|
New York Metro |
1,604,494 |
4,933,563 |
20.9% |
28.6% |
i. Population Reference Bureau (PRB) analysis of the Census Bureau’s 2007 Basic Monthly Current Population Survey (CPS). The PRB data was collected for us by the Working Poor Families Project, a foundation-funded national initiative that works with 26 nonprofit organizations to strengthen state policies affecting working low-income families. CUF is one of two groups working on this project in New York State.
ii. The denominator for this measure is composed of workers 18 and older who are either (1) paid hourly or (2) not paid hourly, but whose hourly rate can be calculated using earnings per week and hours worked per week. Workers who do not have an hourly rate or whose hourly rate cannot be calculated are excluding from this analysis.
A low-wage worker is defined as an individual 18 and older who is either employed at work or employed absent from work who earns below a state specific "low wage" figure (i.e., the national low wage figure multiplied by the state cost of living index). The national low wage figure was based upon the preliminary weighted average poverty threshold for a family of four in 2011 ($23,497). If a person works full-time for one year (i.e., 40 hours per week for 52 weeks per year) and earns $23,497 per year, that person would be making $11.30 per hour. The state cost of living indices used here, from 2006-2010, are published in the article, “Regional Price Parities for States and Metropolitan Areas, 2006-2010,” by Bettina H. Aten, Eric B. Figueroa, and Troy M. Martin, (Survey of Current Business, August 2012): Table 1. The article is available online at http://www.bea.gov/scb/pdf/2012/08%20August/0812_regional_price_parities.pdf (Jan. 11, 2013).