
data

Data - February 2013
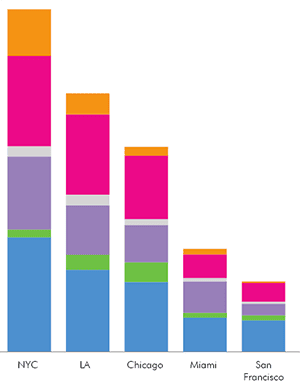
Texas Two StepThere has been a huge spike in the number of New Yorkers relocating to Texas in recent years, even at a time when fewer city residents were departing for Charlotte, Atlanta, Philadelphia and other traditional destinations.
Data - January 2013
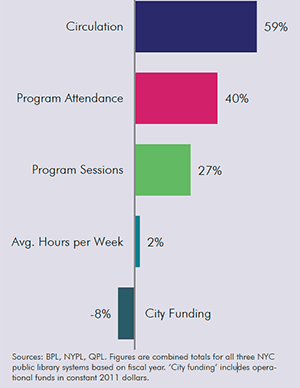
Data from Branches of OpportunitySelected charts and graphs from the Center for an Urban Future's major January 2013 report on NYC's public libraries. The report found that public libraries are serving more people in more ways than ever before, and have become an increasingly critical part of the city’s human capital system; but they have been undervalued by policymakers and face growing threats in today’s digital age.
Data - August 2012
Data from Smarter Small BusinessesSelected charts and graphs from the Center for an Urban Future's August 2012 report on technology use among NYC's small businesses. The report found that far too many of NYC's small businesses still aren't using websites, online ads and other technology tools, a huge missed opportunity at a time when small firms face increasing competition from national chains and online companies.
Data - May 2012
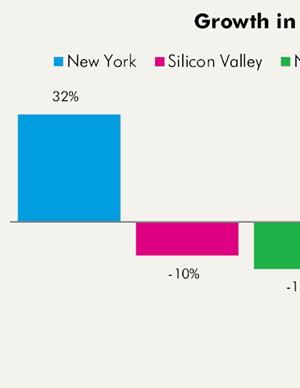
Data from New Tech CitySelected charts and graphs from the Center for an Urban Future's major May 2012 report on NYC's tech sector. The report found that, riding a wave of start-ups, New York has emerged as a national leader in fields that leverage the Internet and mobile technologies—a development that has provided a key economic boost and left the city well positioned for future tech growth.
Data - March 2012
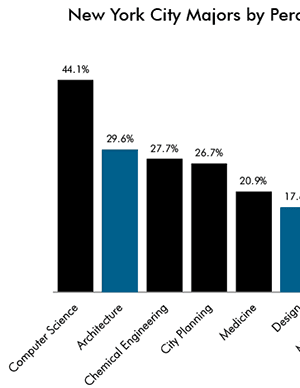
Data from Designing New York's FutureSelected charts and graphs from the Center for an Urban Future's March 2012 report on NYC's design schools. The report found that New York City graduates twice as many students in design and architecture as any other U.S. city, but the city's design schools are not only providing the talent pipeline for New York's creative industries—they have become critical catalysts for innovation, entrepreneurship and economic growth.
Data - January 2012
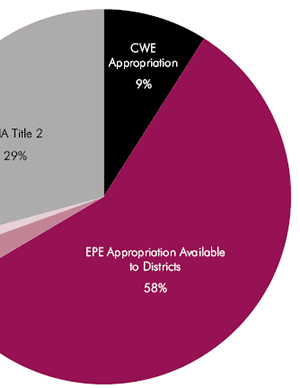
Data from Bad EnglishSelected charts and graphs from the Center for an Urban Future's January 2012 policy brief which found that communities from Albany and Syracuse to Queens and Staten Island are experiencing an influx of immigrants, many of whom lack English proficiency—but the number of state-funded ESOL classes has declined in recent years.
Data - November 2011
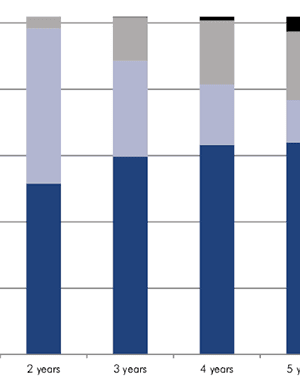
Data from Mobility MakersSelected charts and graphs from the Center for an Urban Future's November 2011 report on NYC's community colleges. The report found that community colleges are crucial platforms for economic mobility in today's knowledge economy, but showed that too few of those enrolled in these institutions actually graduate.
Data - September 2011
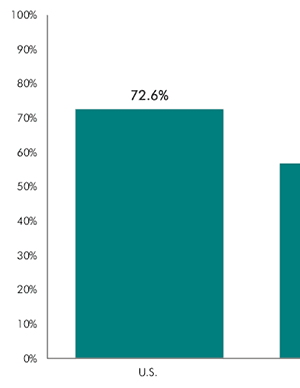
Data from Failing the TestSelected charts and graphs from the Center for an Urban Future's September 2011 report which examined several options for improving the GED system: whether New York should charge a fee for test takers, the benefits and costs of the official practice test, availability and quality of preparatory instruction and providing a bridge from GED to postsecondary education and training.
Data - September 2011
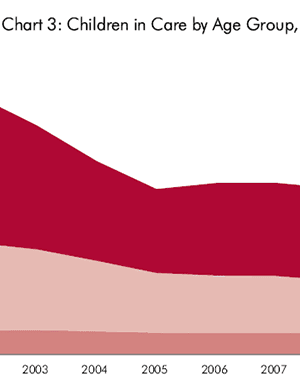
Data from Fostering CareersSelected charts and graphs from the Center for an Urban Future's major September 2011 study which revealed that an alarming share of young people who age out of New York City's foster care system are failing to obtain and hold on to jobs, and that part of the problem is that city government and foster care agencies are either not adequately focused on providing workforce preparation services to these youngsters or not equipped to do so.
Data - June 2011
Data from Growth by DesignSelected charts and graphs from the Center for an Urban Future's June 2011 report which detailed the powerful economic impact of New York's architecture and design sectors. It showed that New York has far more designers than any other U.S. city, but concluded that far more could be done to harness the sector's growth potential.