New York City’s second annual design week, NYCxDesign, will make its debut tomorrow, showcasing the city’s powerful assets in a range of design fields. With hundreds of exhibits, studio visits and talks taking place across the five boroughs between May 9th and May 20th, NYCxDesign aims to raise the profile of one of the city’s most important and underappreciated economic sectors.
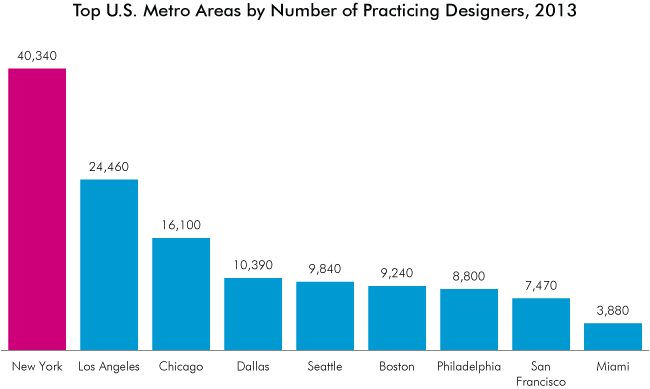
Without a doubt, the architecture and design sector is a critical and growing part of New York City’s economy. As this analysis documents, in 2013 the New York City metro area was home to 40,340 full-time designers. That is far and away more designers than any other metro area in the U.S., with the next largest pool in Los Angeles, which has 24,460, followed by Chicago (16,100). The number of designers in New York is also up significantly from 2010, when there were 38,340 designers, and 2000, when there were 23,143. These designers work not only at architecture and design companies, but in a wide variety of industries, including the arts, media, advertising, healthcare, retail, manufacturing, real estate, and financial services.
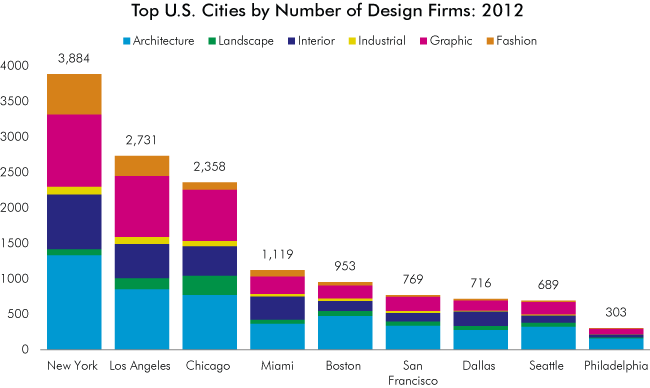
New York City is also an international hub for design firms working in fashion, architecture, landscape architecture, interior design, industrial design, and graphic design. Overall, the city is home to 3,884 firms in these six subsectors, compared to 2,731 in Los Angeles and 2,358 in Chicago.
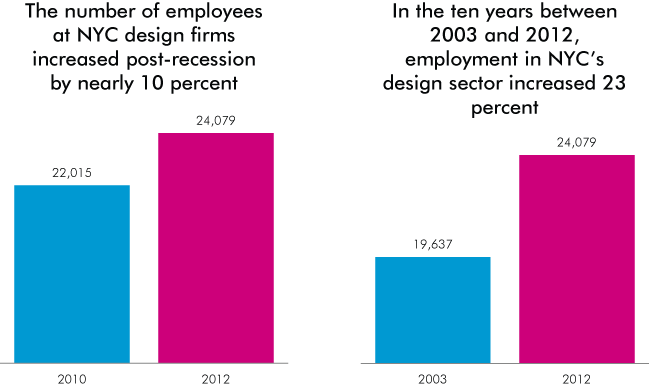
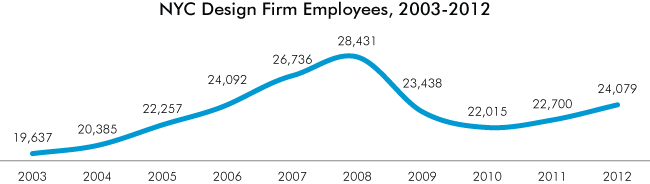
Although employment at design firms dipped in the wake of the 2008 financial crisis, the number of design sector jobs bounced back quickly after the economy started to pick up again. Between 2010 and 2012, the number of employees at city design firms increased by nearly 10 percent, going from a post-recession low of 22,015 in 2010 to 24,079 two years later. In the ten years between 2003 and 2012, employment in the city’s design sector increased 23 percent.
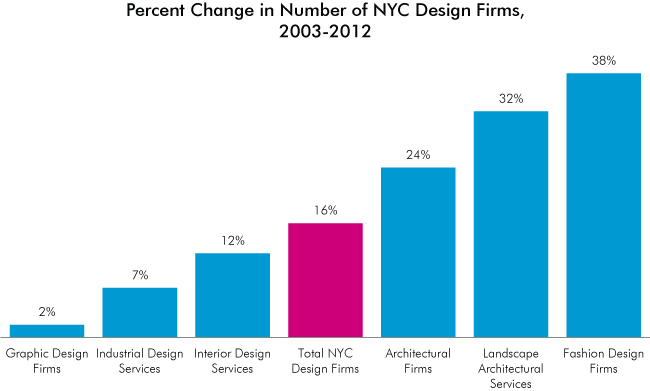
Citywide, three different design fields saw increases of at least 20 percent in the number of firms between 2003 and 2012: fashion design (with a 38 percent increase in firms), landscape design (+32 percent) and architecture (+24 percent). The number of firms increased by smaller amounts in other design fields, including interior design (+12 percent), industrial design (+7 percent) and graphic design (+2 percent).
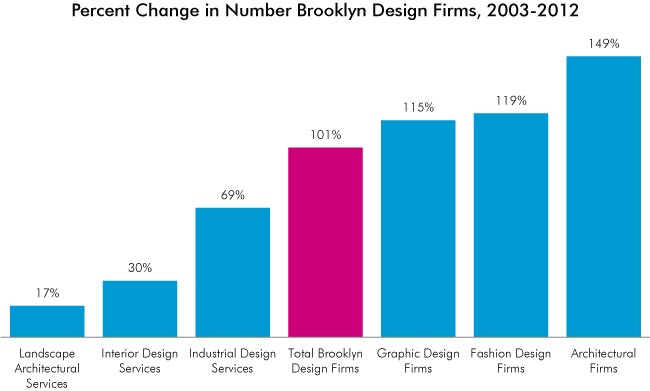
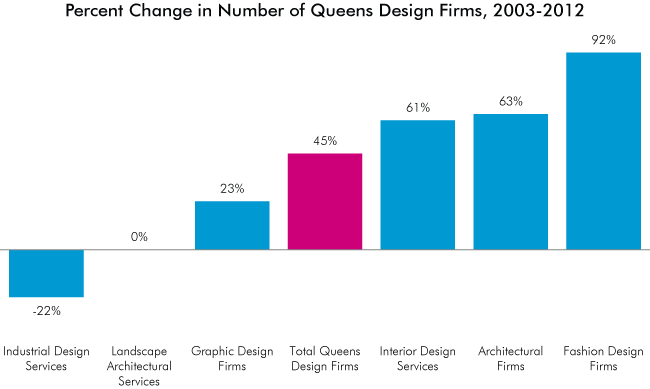
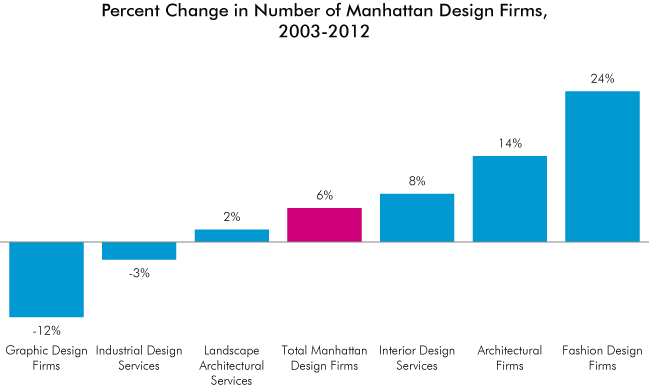
Over this period, Brooklyn and Queens have both outpaced Manhattan in the growth of design firms. While the number of all design firms in Manhattan increased by just 6 percent during this time, Brooklyn experienced a 101 percent gain and Queens a 45 percent gain. Brooklyn experienced a significant spike in firms in nearly every design field, including architecture (149 percent increase), fashion design (+119 percent) and graphic design (+115 percent). Queens saw a 63 percent increase in architectural firms and a 61 percent increase in interior design firms. Over the same period, Manhattan experienced a 24 percent increase in fashion design firms, a 14 percent increase in architecture firms, and a 12 percent decrease in graphic design firms.
However, though the rate of growth is higher in Brooklyn and Queens, Manhattan is still very much the center of the city’s design sector; the borough is home to 2,989 firms employing 21,684 people, compared to 532 firms employing 1,472 people in Brooklyn and 273 firms employing 785 people in Queens.
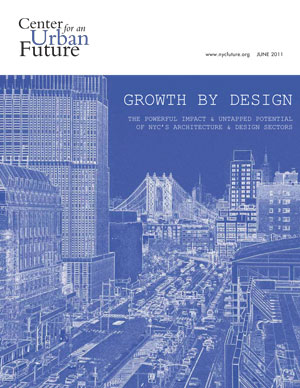
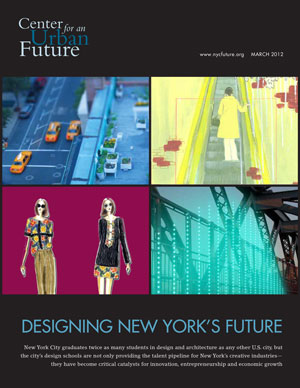
This report is a follow-up to several previous reports published by the Center for an Urban Future about the economic importance of New York’s design industries, including Growth By Design (2011), Designing New York’s Future (2012) and 8 Ways to Grow NYC’s Design Sector (2013).
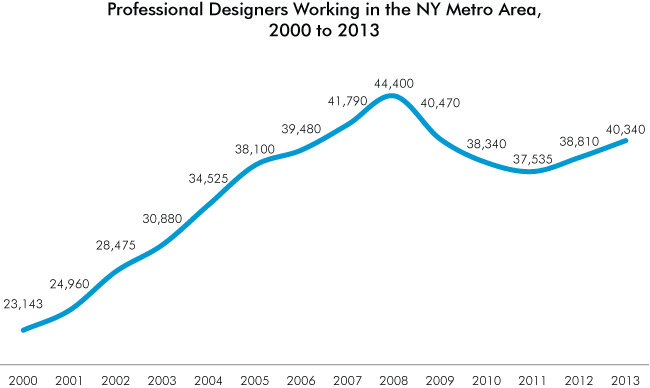
Source: Occupational Employment Survey (OES); Bureau of Labor Statistics (BLS), 2013. New York-White Plains-Wayne Metro Division. See Note 1.
Source: OES; BLS, 2013. Numbers represent Metro Division estimates. See Note 2.
Source: Quarterly Census of Employment and Wages (QCEW); BLS, 2012. Numbers represent county level estimates. See Note 3.
Source: QCEW; BLS, 2003-2012.
Source: QCEW; BLS, 2003-2012.
Source: QCEW; BLS, 2003-2012.
Source: QCEW; BLS, 2003-2012.
Source: QCEW; BLS, 2003-2012.
Source: QCEW; BLS, 2003-2012.
|
Growth of Design Firms in New York City: 2003-2012 |
|---|
|
|
2003 |
2004 |
2005 |
2006 |
2007 |
2008 |
2009 |
2010 |
2011 |
2012 |
|
Graphic Design Firms |
1000 |
973 |
958 |
981 |
1040 |
1083 |
1049 |
1032 |
1017 |
1018 |
|
Industrial Design Services |
99 |
99 |
104 |
106 |
110 |
118 |
119 |
115 |
111 |
106 |
|
Interior Design Services |
692 |
691 |
728 |
750 |
816 |
866 |
846 |
815 |
788 |
775 |
|
Total NYC Design Firms |
3340 |
3366 |
3459 |
3578 |
3848 |
4058 |
3969 |
3911 |
3880 |
3884 |
|
Architectural Firms |
1073 |
1095 |
1149 |
1224 |
1295 |
1342 |
1323 |
1315 |
1330 |
1333 |
|
Landscape Architectural Services |
62 |
86 |
90 |
88 |
93 |
99 |
92 |
86 |
82 |
82 |
|
Fashion Design Firms |
414 |
422 |
430 |
429 |
494 |
550 |
540 |
548 |
552 |
570 |
Source: QCEW; BLS, 2003-2012.
|
Growth of Design Firms in Brooklyn: 2003-2012 |
|---|
|
|
2003 |
2004 |
2005 |
2006 |
2007 |
2008 |
2009 |
2010 |
2011 |
2012 |
|
Landscape Architectural Services |
12 |
14 |
14 |
12 |
13 |
14 |
12 |
10 |
11 |
14 |
|
Interior Design Services |
50 |
53 |
53 |
63 |
68 |
67 |
64 |
66 |
59 |
65 |
|
Industrial Design Services |
16 |
17 |
17 |
18 |
23 |
26 |
26 |
29 |
30 |
27 |
|
Total Brooklyn Design Firms |
265 |
283 |
282 |
315 |
373 |
430 |
430 |
457 |
491 |
532 |
|
Graphic Design Firms |
85 |
90 |
90 |
102 |
115 |
141 |
139 |
154 |
168 |
183 |
|
Fashion Design Firms |
37 |
38 |
38 |
38 |
50 |
60 |
63 |
69 |
73 |
81 |
|
Architectural Firms |
65 |
71 |
70 |
82 |
104 |
122 |
126 |
129 |
150 |
162 |
Source: QCEW; BLS, 2003-2012.
|
Growth of Design Firms in Queens: 2003-2012 |
|---|
|
|
2003 |
2004 |
2005 |
2006 |
2007 |
2008 |
2009 |
2010 |
2011 |
2012 |
|
Industrial Design Services |
9 |
6 |
6 |
5 |
6 |
7 |
8 |
8 |
8 |
7 |
|
Landscape Architectural Services |
12 |
12 |
13 |
13 |
11 |
10 |
10 |
11 |
11 |
12 |
|
Graphic Design Firms |
53 |
52 |
50 |
53 |
54 |
58 |
60 |
58 |
64 |
65 |
|
Total Queens Design Firms |
2077 |
196 |
213 |
230 |
252 |
271 |
269 |
258 |
264 |
273 |
|
Interior Design Services |
38 |
39 |
44 |
49 |
64 |
70 |
71 |
62 |
58 |
61 |
|
Architectural Firms |
63 |
69 |
82 |
90 |
94 |
100 |
96 |
95 |
96 |
103 |
|
Fashion Design Firms |
13 |
18 |
18 |
20 |
23 |
26 |
24 |
24 |
27 |
25 |
Source: QCEW; BLS, 2003-2012.
|
Growth of Design Firms in Manhattan: 2003-2012 |
|---|
|
|
2003 |
2004 |
2005 |
2006 |
2007 |
2008 |
2009 |
2010 |
2011 |
2012 |
|
Graphic Design Firms |
856 |
819 |
805 |
811 |
852 |
866 |
830 |
801 |
766 |
752 |
|
Industrial Design Services |
70 |
70 |
75 |
77 |
77 |
80 |
80 |
73 |
69 |
68 |
|
Landscape Architectural Services |
50 |
53 |
55 |
57 |
63 |
67 |
62 |
59 |
55 |
51 |
|
Total Manhattan Design Firms |
2833 |
2804 |
2873 |
2937 |
3119 |
3254 |
3166 |
3098 |
3029 |
2989 |
|
Interior Design Services |
590 |
586 |
613 |
624 |
667 |
711 |
692 |
670 |
656 |
636 |
|
Architectural Firms |
903 |
913 |
953 |
1001 |
1045 |
1074 |
1058 |
1051 |
1042 |
1029 |
|
Fashion Design Firms |
364 |
363 |
372 |
367 |
415 |
456 |
444 |
444 |
441 |
453 |
Source: QCEW; BLS, 2003-2012.
|
Design Industry Employment by Borough |
|---|
|
Brooklyn |
2003 |
2010 |
2011 |
2012 |
|
Architectural Firms |
299 |
387 |
506 |
551 |
|
Landscape Architectural Services |
27 |
21 |
82 |
92 |
|
Interior Design Services |
110 |
167 |
130 |
139 |
|
Industrial Design Services |
18 |
67 |
88 |
88 |
|
Graphic Design Firms |
128 |
285 |
335 |
425 |
|
Fashion Design Firms |
100 |
124 |
141 |
177 |
|
Brooklyn Design Firms Employees |
682 |
1051 |
1282 |
1472 |
|
|
|
|
|
|
|
Bronx |
2003 |
2010 |
2011 |
2012 |
|
Architectural Firms |
13 |
13 |
11 |
11 |
|
Landscape Architectural Services |
ND |
15 |
ND |
ND |
|
Interior Design Services |
16 |
11 |
11 |
12 |
|
Industrial Design Services |
ND |
ND |
ND |
ND |
|
Graphic Design Firms |
4 |
9 |
14 |
13 |
|
Fashion Design Firms |
ND |
16 |
11 |
10 |
|
Bronx Design Firms Employees |
33 |
64 |
47 |
46 |
|
|
|
|
|
|
|
Queens |
2003 |
2010 |
2011 |
2012 |
|
Architectural Firms |
230 |
297 |
287 |
323 |
|
Landscape Architectural Services |
ND |
16 |
14 |
21 |
|
Interior Design Services |
116 |
129 |
138 |
178 |
|
Industrial Design Services |
18 |
ND |
ND |
ND |
|
Graphic Design Firms |
136 |
132 |
135 |
195 |
|
Fashion Design Firms |
44 |
48 |
74 |
68 |
|
Queens Design Firms Employees |
544 |
622 |
648 |
785 |
|
|
|
|
|
|
|
Manhattan |
2003 |
2010 |
2011 |
2012 |
|
Architectural Firms |
9053 |
10396 |
10788 |
11406 |
|
Landscape Architectural Services |
330 |
346 |
304 |
323 |
|
Interior Design Services |
2134 |
2166 |
2255 |
2399 |
|
Industrial Design Services |
253 |
350 |
252 |
264 |
|
Graphic Design Firms |
4536 |
4260 |
4464 |
4317 |
|
Fashion Design Firms |
1904 |
2663 |
2563 |
2975 |
|
Manhattan Design Firms Employees |
18210 |
20181 |
20626 |
21684 |
|
|
|
|
|
|
|
Staten Island |
2003 |
2010 |
2011 |
2012 |
|
Architectural Firms |
113 |
72 |
74 |
75 |
|
Landscape Architectural Services |
ND |
ND |
ND |
ND |
|
Interior Design Services |
17 |
15 |
14 |
17 |
|
Industrial Design Services |
16 |
ND |
ND |
ND |
|
Graphic Design Firms |
ND |
10 |
ND |
ND |
|
Fashion Design Firms |
ND |
ND |
9 |
ND |
|
Staten Island Design Firms Employees |
146 |
97 |
97 |
92 |
Source: QCEW; BLS, 2003-2012. See Note 4.
Notes
1. Because survey data was suppressed for select occupational categories in 2001, 2003, 2004 and 2011, an average of the year before and year after was used. For 2000, 2001, 2002 and 2003, an average of subsequent years was used for the 'Designers, All Other' category, since it was first introduced in 2004. Note also that the New York-White Plains-Wayne Metro Division definition changed slightly in 2005 to include three additional counties in New Jersey. Part of the increase between 2004 and 2005 should therefore be attributed to that change
2. Metro Division definitions are as follows: Boston (Boston-Quincy NECTA Division); Chicago (Chicago-Naperville-Joliet Metro Division); Dallas (Dallas-Plano-Irving Metro Division); Los Angeles (Los Angeles-Long Beach-Glendale Metro Division); Miami (Miami-Miami Beach-Kendall Metro Division); San Francisco (San Francisco-San Mateo-Redwood City Metro Division); Seattle (Seattle-Bellevue-Everett Metro Division).
3. County definitions are as follows: New York City (Bronx, Kings, Queens, New York, Richmond); Chicago (Cook); Dallas (Dallas); Los Angeles (Los Angeles); Miami (Miami-Dade); San Francisco (San Francisco); Seattle (King); Philadelphia (Philadelphia).
4. ND: Not Disclosable -- data did not meet BLS or State agency disclosure standards.