Data - January 2015
New York State’s Language Barrier
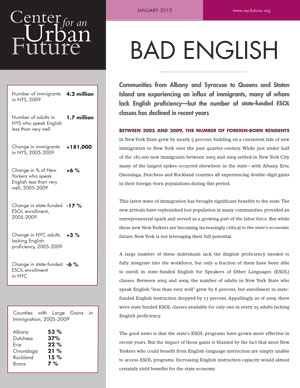
Nearly every corner of New York State is experiencing a spike in immigrants—with the fastest growth occurring upstate—but funding for ESOL classes has not kept pace.
Innovative Ideas. Independent Policy.
In recent years, nearly every corner of New York State has seen a significant influx of immigrants. Between 2005 and 2013, the state’s immigrant population grew by 386,000 people, and the six counties with the fastest growth of foreign-born residents were all located outside of New York City. Overall, nine of the 10 counties with at least a 10 percent increase in their foreign born population during this period were outside of New York City, with Albany County leading the way (with a 48 percent increase in foreign born population) followed by Dutchess (32 percent), Onondaga (28 percent), Erie (27 percent), Suffolk (25 percent), Rockland (19 percent), Bronx (14 percent), Nassau (13 percent), Orange (12 percent) and Monroe (10 percent).[ii]
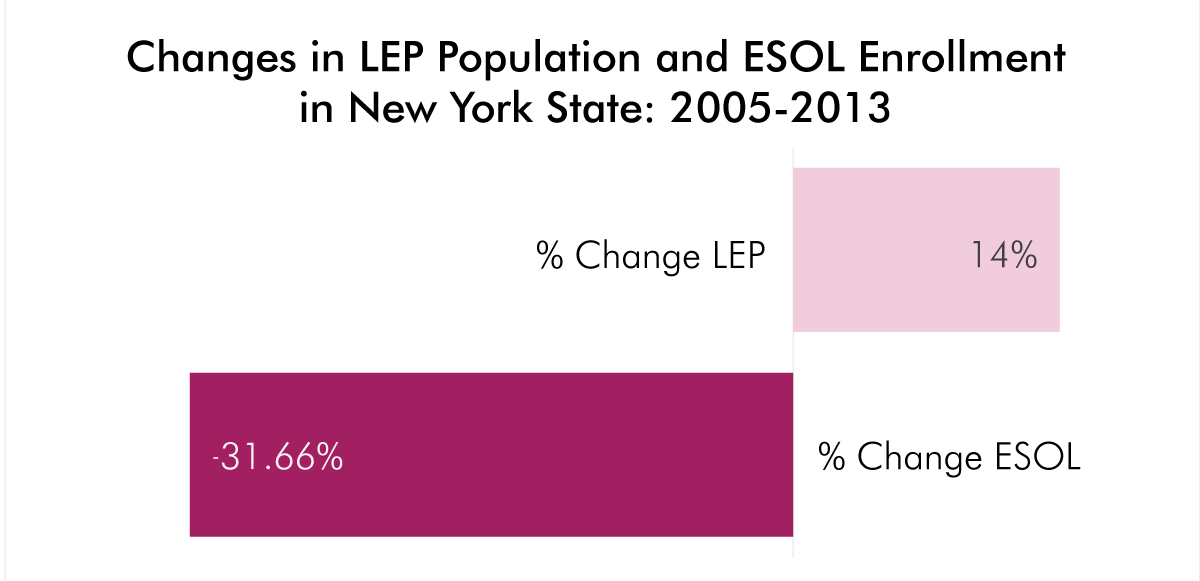
But while immigrants represent a growing share of the workforce throughout the state and have the potential to provide an economic spark to many upstate cities, the state’s investment in programs that help newcomers learn English has failed to keep pace. In fact, the number of state-funded ESOL seats has declined by 32 percent over the last nine years, from approximately 86,000 seats in 2005 to 59,000 in 2013.[iii]
The number of New Yorkers served in ESOL programs has dropped not because of funding cuts—state funds have actually remained flat over this period—but due to the rise in per student costs. Indeed, to its credit, officials with the State Education
Department’s Office of Adult Education Programs and Policy (AEPP) have encouraged ESOL providers to give their students more time in class, a strategy that has clearly led to more effective programs.[iv] Over the past half-decade, the rate at which students advanced to the next literacy level jumped by almost half, from 38 percent to 55 percent.[v]
While the new focus on quality of instruction has clearly produced positive results, it is troubling that significantly fewer New Yorkers have access to English language instruction at a time when the number of residents lacking English proficiency is only growing.
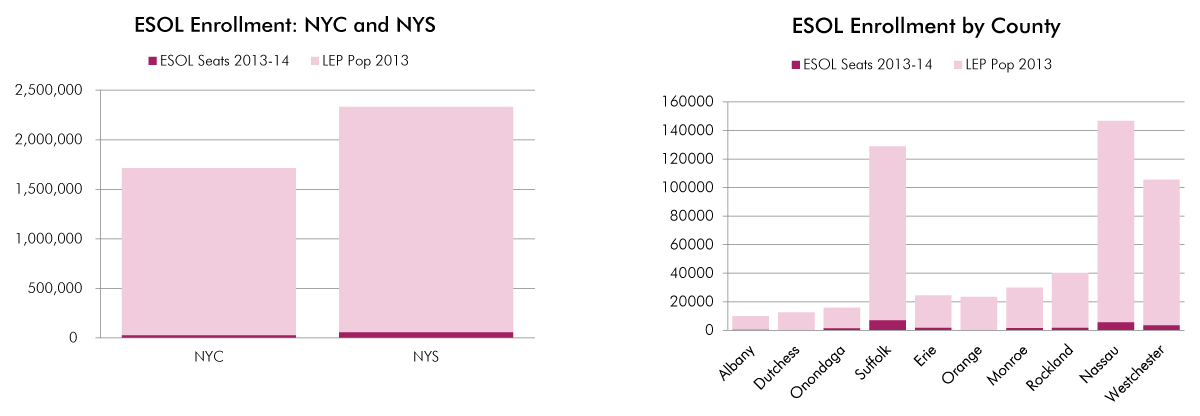
Statewide, the number of residents who speak English less than very well grew by 14 percent—or 273,000 residents—between 2005 and 2013.[vi] But the number of state-funded ESOL seats across the state declined by 32 percent during this period. While 2.3 million people in the state now have limited English proficiency, there are just 59,064 state-funded ESOL seats. Overall, state-funded ESOL seats can accommodate only 1 in 39 residents lacking English proficiency.
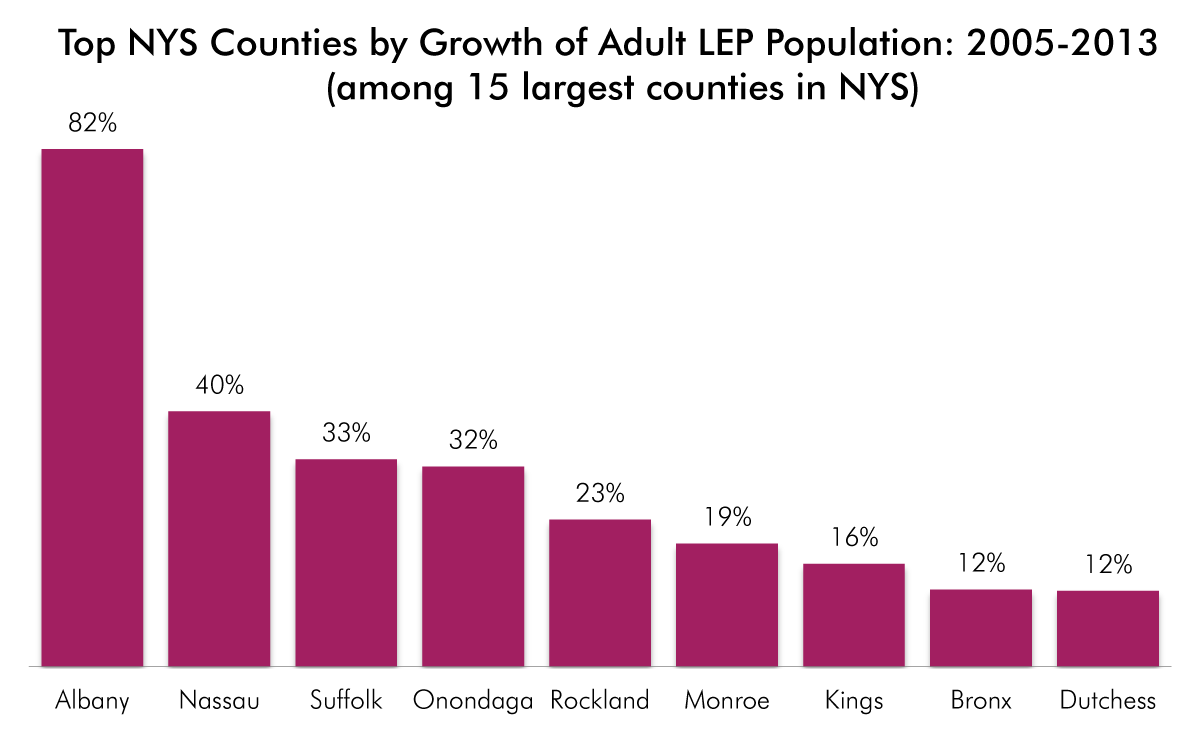
The number of individuals with limited English proficiency (LEP) increased by at least 20 percent in five counties between 2005 and 2013: Albany (which registered an 82 percent increase), Nassau (40 percent), Suffolk (33 percent), Onondaga (32 percent), and Rockland (23 percent).
Yet several counties have a shockingly small number of state-funded ESOL seats: Albany County has just 564 seats, Dutchess has 229 and Orange has 102.
In recent years, New York State has taken several important steps to embrace immigrants. But more investment is needed in programs that help the state’s newest residents to learn English and integrate into the workforce. Such an investment would provide a key lift for immigrants, aid employers around the state who are increasingly hiring immigrants and deliver significant economic benefits to the state’s economy. It would also provide a boost for a significant share of the state’s working poor families. Statewide, 221,105 or 37 percent of low-income working families (earning less than 200% of the federal poverty level) include one or more adults who speak English less than well.[vii]
Research has shown that while many immigrants recognize that English proficiency is critical to a better economic future, a significant share of first and second generation immigrants lack workforce skills or lag significantly behind their nonimmigrant peers in terms of high school graduation, college access, and postsecondary degree completion.[viii]
By the Numbers
The following are highlights about the growth in the number of immigrants, the number of residents with limited English proficiency and number of ESOL seats in the state’s largest counties outside of New York City.
| Top Counties by Growth of Foreign-Born Population (among 15 largest counties in NYS) | |||||||
|---|---|---|---|---|---|---|---|
| County | Foreign-Born Pop. 2005 | Foreign-Born Pop 2013 | Foreign-Born % Change 05-13 | Total 05-13 | Native-Born Pop 2005 | Native-Born Pop 2013 | Native-Born %Change |
| Albany | 18,735 | 27,683 | 47.76% | 8,948 | 261,838 | 277,583 | 6.01% |
| Dutchess | 25,516 | 33,791 | 32.43% | 8,275 | 251,373 | 260,753 | 3.73% |
| Onondaga | 24,974 | 32,063 | 28.39% | 7,089 | 419,354 | 432,255 | 3.08% |
| Erie | 45,898 | 58,309 | 27.04% | 12,411 | 853,083 | 851,847 | -0.14% |
| Suffolk | 183,360 | 229,149 | 24.97% | 45,789 | 1,261,282 | 1,260,057 | -0.10% |
| Rockland | 58,066 | 69,186 | 19.15% | 11,120 | 227,022 | 249,239 | 9.79% |
| Bronx | 418,643 | 478,518 | 14.30% | 59,875 | 890,997 | 850,638 | -4.53% |
| Nassau | 261,428 | 295,966 | 13.21% | 34,538 | 1,048,648 | 1,053,457 | 0.46% |
| Orange | 36,840 | 41,387 | 12.34% | 4,547 | 322,249 | 328,844 | 2.05% |
| Monroe | 52,993 | 58,525 | 10.44% | 5,532 | 652,000 | 676,916 | 3.82% |
| New York (Man) | 428,679 | 462,054 | 7.79% | 33,375 | 1,101,095 | 1,129,934 | 2.62% |
| Westchester | 228,796 | 246,213 | 7.61% | 17,417 | 687,120 | 712,193 | 3.65% |
| Kings (Brooklyn) | 916,682 | 964,558 | 5.22% | 47,876 | 1,529,334 | 1,573,960 | 2.92% |
| Queens | 1,054,660 | 1,104,905 | 4.76% | 50,245 | 1,160,679 | 1,165,346 | 0.40% |
| Richmond (SI) | 97,058 | 96,626 | -0.45% | -432 | 358,286 | 370,409 | 3.38% |
| Source: American Community Survey, 2005 and 2013 (1 year estimates). | |||||||
Source: American Community Survey, 2005 and 2013 (1 year estimates).
| Top Counties by Growth of Adult LEP Population (among 15 largest counties in NYS) | |||
|---|---|---|---|
| County | % Change LEP 05-13 | LEP 18+ 2013 | LEP 18+ 2005 |
| Albany | 82% | 9,398 | 5,173 |
| Nassau | 40% | 140,847 | 100,410 |
| Suffolk | 33% | 121,572 | 91,596 |
| Onondaga | 32% | 14,266 | 10,841 |
| Rockland | 23% | 38,379 | 31,157 |
| Monroe | 19% | 28,193 | 23,609 |
| Kings | 16% | 510,692 | 439,406 |
| Bronx | 12% | 307,331 | 274,015 |
| Dutchess | 12% | 12,304 | 10,991 |
| Queens | 11% | 598,003 | 538,908 |
| Westchester | 8% | 101,931 | 94,189 |
| Erie | 4% | 22,438 | 21,675 |
| New York (Man) | 0% | 224,604 | 225,551 |
| Orange | -6% | 23,266 | 24,834 |
| Richmond (SI) | -7% | 43,195 | 46,433 |
| Source: American Community Survey 2005 and 2013 (1 year estimates). | |||
Source: Adult Literacy Center and American Community Survey 2013 (1 year estimates).
| ESOL Enrollment by County | ||
|---|---|---|
| County | ESOL Enrollment 2013-14 | LEP Pop 2013 |
| Albany | 564 | 9,398 |
| Dutchess | 229 | 12,304 |
| Onondaga | 1,572 | 14,266 |
| Suffolk | 7,202 | 121,572 |
| Erie | 2,052 | 22,438 |
| Orange | 102 | 23,266 |
| Monroe | 1,728 | 28,193 |
| Rockland | 1,929 | 38,379 |
| Nassau | 5,858 | 140,847 |
| Westchester | 3,682 | 101,931 |
| NYC | 28,862 | 1,683,825 |
| NYS | 59,064 | 2,271,964 |
| Source: Adult Literacy Center and American Community Survey 2013 (1 year estimates). | ||
Source: Adult Literacy Center and American Community Survey 2013 (1 year estimates).
| ESOL Funding in NYS | |||||
|---|---|---|---|---|---|
| Year | Federal WIA | EPE | CWE Allocation | ALE | Total |
| 2005 | $23,235,950 | $46,475,000 | $6,325,000 | $1,828,585 | $77,864,535 |
| 2006 | $22,768,219 | $46,475,000 | $6,325,000 | $1,828,585 | $77,396,804 |
| 2007 | $22,709,881 | $46,475,000 | $6,325,000 | $3,478,585 | $78,988,466 |
| 2008 | $22,326,629 | $46,475,000 | $6,325,000 | $3,798,223 | $78,924,852 |
| 2009 | $21,129,516 | $45,650,000 | $7,150,000 | $3,453,795 | $77,383,312 |
| 2010 | $24,940,931 | $45,650,000 | $7,150,000 | $2,348,161 | $80,089,092 |
| 2011 | $23,189,071 | $46,475,000 | $6,325,000 | $2,361,150 | $78,350,221 |
| 2012 | $23,216,178 | $45,650,000 | $7,150,000 | $2,911,150 | $78,927,328 |
| 2013 | $22,330,560 | $45,650,000 | $7,150,000 | $3,461,150 | $78,591,710 |
| 2014 | $22,396,419 | $45,650,000 | $7,150,000 | $3,461,150 | $78,657,569 |
| Source: NYS Education Department. ESOL funding levels are estimates based on 55 percent of total adult education funding. In 2014, total adult education funding was $143 million. | |||||
Additional Reading:
Strengthening State Adult Education Policies For English as a Second Language Populations, Working Poor Families Project, by Barry Shaffer, Fall 2014.
Investing in English Skills: The Limited English Proficient Workforce in US Metropolitan Areas, Brookings Institution Metropolitan Policy Program, by Jill Wilson, September 2014.
Bad English, Center for an Urban Future, by Tom Hilliard, January 2012.
An Action Agenda for ESOL, Center for an Urban Future, March 2010.
Lost in Translation, Center for an Urban Future, by Tara Colton, November 2006.
Demographic data is from the American Community Survey (2005 and 2013 1-year estimates).
[iv] Tom Hilliard, “Bad English,” Center for an Urban Future, January 2012.
[vi] The American Community Survey (2005 and 2013 1-year estimates).
[vii] Barry Shaffer, “Strengthening State Adult Education Policies
For English as a Second Language Populations,” Working Poor Families Project, Fall 2014.
© All Rights Reserved.