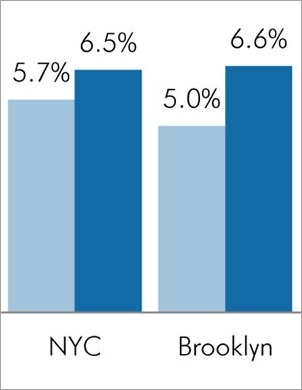
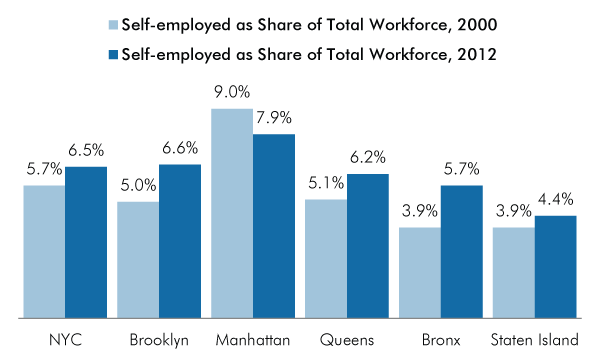
New York City is now home to nearly a quarter million self-employed workers, and this segment of the workforce increased by 31 percent between 2000 and 2012. As of 2012, 6.5 percent of the city’s working adults were self-employed, up from 5.7 percent in 2000.
Brooklyn alone has 72,503 self-employed workers, more than any other borough. Manhattan (67,580 self-employed) and Queens (66,763) have a nearly identical number of self-employed workers, while the Bronx has 31,035 and Staten Island has 9,144. While the number of self-employed workers in Brooklyn increased by a whopping 57.7 percent over the last 12 years, it was the Bronx that experienced the largest percentage increase in its self-employed population during this period. The number of self-employed grew by 87.3 percent in the Bronx. Between 2000 and 2012, the self-employed population also spiked in Queens (+ 38.0 percent) and Staten Island (+20.1 percent) but declined in Manhattan (-2.8 percent). In Manhattan, however, self-employed workers comprise a larger share of the workforce (7.9 percent) than in any other borough.
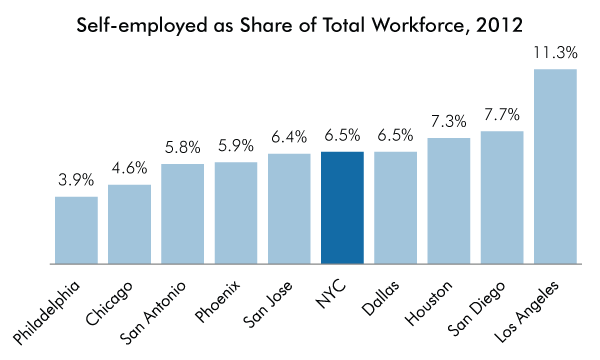
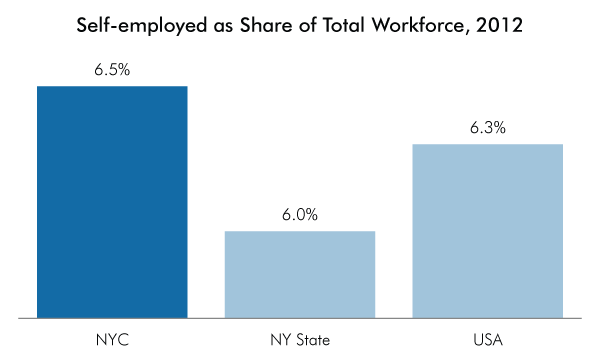
New York City has a greater self-employment rate (6.5 percent) than New York State (6.0 percent) and the United States (6.3 percent). However, among the 10 most populous US cities, New York has the fourth highest self-employment rate, with Los Angeles first (11.3 percent self-employment rate), followed by San Diego (7.7 percent) and Houston (7.3 percent). Among the 10 largest cities, Philadelphia (3.9 percent) and Chicago (4.6 percent) have the lowest self-employment rates.
|
Growth in NYC's Self-Employed, 2000 - 2012 |
|---|
|
|
Self-employed, 2000 |
Self-employed, 2012 |
Change 2000 - 2012 |
% Change 2000 - 2012 |
|
NYC |
188,054 |
247,025 |
58,971 |
31.4% |
|
Brooklyn |
45,971 |
72,503 |
26,532 |
57.7% |
|
Manhattan |
69,517 |
67,580 |
-1,937 |
-2.8% |
|
Queens |
48,383 |
66,763 |
18,380 |
38.0% |
|
Bronx |
16,572 |
31,035 |
14,463 |
87.3% |
|
Staten Island |
7,611 |
9,144 |
1,533 |
20.1% |
Source: U.S. Census Bureau, 2008-2012 American Community Survey & 2000 US Census. Data is for "self-employed workers in own not-incorporated businesses".