Out of Reach: Too Few New Yorkers Are Earning a High School Equivalency Diploma
Earning a high school equivalency can open the door to better jobs, skills-building programs, and a postsecondary education for the nearly 1.5 million New Yorkers without a high school diploma. But the number of New Yorkers earning a high school equivalency is just half what it was in 2010, and overall trends are cause for concern.
Today nearly 1.5 million adult New Yorkers lack a high school diploma, putting them at an enormous disadvantage in today’s credential-driven economy and hurting the state’s economic competitiveness. Despite the urgency of the problem, relatively few New Yorkers are taking and passing the state’s high school equivalency exam.
In March 2017, the Center for an Urban Future published “Taking to TASC,” which revealed that the number of New Yorkers taking and passing the high school equivalency (HSE) exam had declined in virtually every corner of the state between 2010 and 2015. This new policy brief adds the two most recent years of data to our analysis—2016 and 2017. It shows signs of improvement statewide, as well as continuing cause for concern.
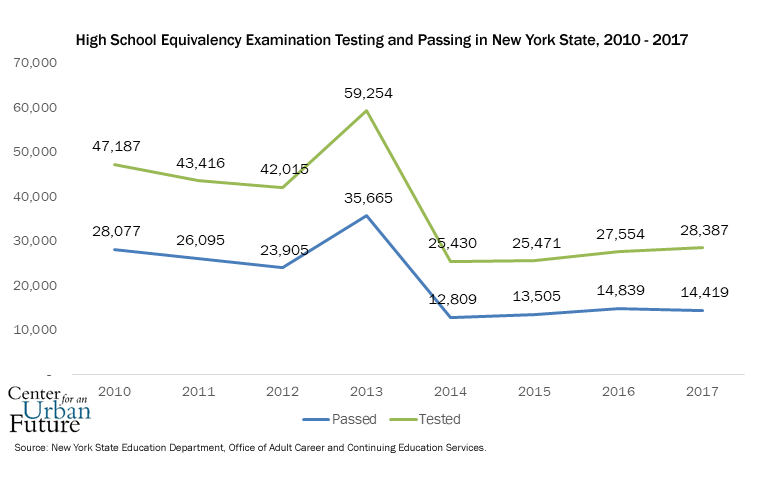
The good news is that there has been a slight uptick in the number of New Yorkers taking and passing the high school equivalency exam over the past two years. The number of HSE test-takers rose from 26,041 in 2015 to 28,387 in 2017—a 9 percent increase, and the number of test passers went up nearly 7 percent during that time, from 13,505 to 14,419. In 8 out of 10 regions across the state, the number of test takers rose between 2015 and 2017, and the number of students passing the test increased in 5 out of 10 regions—led by double-digit gains in the North Country (35 percent increase in attainment) and the Mohawk Valley (16 percent).
But the news isn’t all good. The number of New Yorkers taking the high school equivalency exam is still a fraction of what it was at the start of the decade. Nearly 20,000 fewer New Yorkers took the high school equivalency exam in 2017 (28,387) than in 2010 (47,187). In the three years from 2010 to 2012, an average of 44,206 New Yorkers took the HSE exam. But in the last three years (2015 to 2017), the number of test-takers averaged 27,137.
The number of New Yorkers passing the test has fallen even more precipitously. In 2017, 14,149 people passed the exam, a 49 percent decline from the number of test-passers in 2010 (28,077). Perhaps even more problematic, barely half of the New Yorkers who take the HSE exam pass it, and the numbers are trending in the wrong direction. The pass rate fell to 51 percent in 2017, down from 54 percent in 2016 and from a recent high of 60 percent in 2013.
New York is tied with Texas for the lowest HSE pass rate in the nation, according to our analysis of the 49 states plus the District of Columbia that reported a statewide pass rate in 2016.1
The stakes are high: New York’s economy has left few jobs available to adults who lack a high school diploma, and those jobs that remain typically offer low wages and little opportunity for advancement. Earning a high school equivalency can open the door to better jobs, skills-building programs, and a postsecondary education. But today fewer than 1 percent of eligible New Yorkers are earning a high school equivalency diploma each year.
This steep decline in high school equivalency attainment largely stems from two forces: the switch to a new high school equivalency exam and continued decline of adult education funding. In 2014, New York State replaced the long-reigning GED exam with the Test Assessing Secondary Completion (TASC). Education officials made the change in part because the GED was getting an overhaul, which would make the test harder to complete—as well as more expensive and difficult to administer. However, the TASC is also harder than the old GED, leading to further declines in what was already the nation’s lowest pass rate. New York was one of 24 states to replace the GED in whole or in part, and it almost certainly made the right decision to stave off an even worse outcome. But student outcomes continue to fall well short of the pre-TASC era.
New York is not alone. Every state in our analysis has seen significant declines in the number of high school equivalency test-takers and -passers since 2012. Between 2012 and 2016, the number of test-takers dropped by 46 percent nationally, from 557, 394 to 302,096, compared to a 42 percent decline in New York. The number of people who passed their HSE exam and obtained a diploma dropped by 42 percent nationally (from 361,504 to 209,709) and 41 percent in New York.
The ability of adult educators to meet the challenge of switching to a harder exam has been hampered by declining state and federal adult education funding. Congress has cut funding for adult education through the federal Workforce Innovation and Opportunity Act by 20 percent over the past 15 years. The main state funding source, the Employment Preparation Education (EPE) program, has not increased since 1995. Only a small program that serves nonprofits, Adult Literacy Education (ALE), has received even a small funding bump over the past several years. Investment in adult education has stagnated even as the challenges facing adult learners mount.
Without a major effort to boost the number of New Yorkers taking and passing a high school equivalency exam, attainment is highly unlikely to recover to pre-TASC levels. On the contrary, limited access to a high school equivalency appears to be the new normal. In the years ahead, few eligible adults will obtain an HSE in New York unless state and local policymakers take decisive action to reverse these trends.
Governor Cuomo and the State Legislature should increase their focus on supporting adult students. The state should boost funding for EPE by 40 percent to keep pace with inflation and double support for ALE from just over $7 million annually to roughly $15 million. The state also needs to focus attention and resources on supporting the transition from the GED to the TASC, which will mean increasing funding for testing centers, accelerating the development of computer-based testing centers, and expanding professional development to train instructors. Most critically, the state should ensure that every adult planning to take an HSE exam has access to a comprehensive HSE preparation course that will enable them to earn a diploma and move on to a postsecondary credential.
The Center for an Urban Future’s previous study of high school equivalency attainment analyzed data from 2010 through 2015 and found a major decline in the number of New Yorkers taking and passing the test. This report builds on “Taking to TASC” by adding in the two most recent years of data, 2016 and 2017, and traces the overall trends in HSE attainment across the state.
In addition, this report documents the 2016 high school equivalency testing and passing rates of 49 states and the District of Columbia. The Center for an Urban Future combined testing and passing data for all three major HSE publishers: the Educational Testing Service (publisher of HiSET), DRC (publisher of TASC), and the GED Testing Service. The Center then filled out the gaps in this data by contacting adult education directors in several states for the relevant data points. Oklahoma did not respond, but all other states provided the requested data.
Among the key findings of our analysis:
HSE attainment has improved since 2014, but remains far below pre-TASC levels.
The number of students taking the HSE exam has increased for three years in a row, rising from 25,826 in 2014 to 28,387 in 2017—a 10 percent increase.
In the two years of new data since the Center’s "Taking to TASC" report, both HSE taking and passing rose slightly. The number of students taking an HSE examination rose by 9 percent while the number passing the exam rose by 7 percent.
The number of passers declined between 2016 and 2017, even as the number of test takers rose, leading to a drop in the pass rate from 53 percent in 2015 to 51 percent in 2017.
From 2010 to 2017, the number of students taking the test fell by 40 percent, from 47,187 to 28,387. The number of students who passed the HSE exam fell by 49 percent, from 28,077 to 14,419.
The high school equivalency pass rate has fallen since introduction of the TASC.
The 2017 HSE pass rate was only 51 percent, meaning that almost half of all test-takers failed the test. The pass rate declined from 53 percent in 2015 and 60 percent in 2010.
The most difficult hurdle for test-takers is math. Both the GED and TASC have five subtests: writing, reading, social studies, science, and math. Between 2010 and 2017, the other four subtests’ pass rate slipped from an average of 81 percent to 71 percent. But the math pass rate fell more steeply, from 68 percent to 45 percent.
New York and Texas have the lowest pass rates in the nation, but New York’s drop in HSE attainment is on par with similar declines in other states.
In 2016, New York tied with Texas for the lowest pass rate in the nation at 54 percent. The next lowest rates were in Washington, DC (57 percent) and New Jersey (66 percent).2
Between 2012 and 2016, the number of test-takers dropped by 46 percent nationally, from 572,154 to 307,696, compared to a 42 percent decline in New York. The number of people who passed their HSE exam and obtained a diploma dropped by 42 percent nationally (from 371,794 to 213,728) and 41 percent in New York.
In comparing state-level attainment data, it is important to note that states may apply differing standards for awarding a high school equivalency to students. If a state uses less rigorous standards than New York (e.g., a lower passing score or not requiring test-takers to pass all five subtests), obtaining an HSE may be easier, and potentially less meaningful, than in New York.
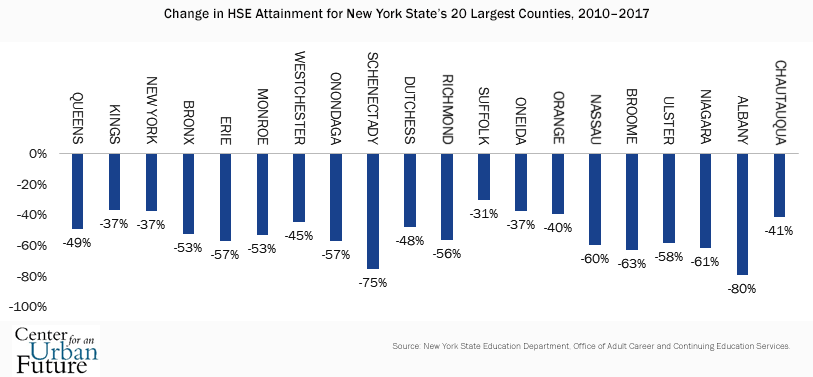
New York’s overall decline in high school equivalency attainment has been steeper outside New York City.
While New York State as a whole saw a 49 percent drop in HSE attainment between 2010 and 2017, the decline did not affect every region equally. New York City’s HSE attainment fell by 45 percent, compared to 52 percent in the rest of the state.
Of the state’s twenty largest counties, the steepest declines were in Albany (-80 percent) and Schenectady (-75 percent) counties. The largest numerical decline took place in Queens, Kings, and Bronx counties. If these three counties alone had maintained their 2010 rates of attainment rates, more than 4,000 additional students would have obtained HSEs.
High school equivalency attainment fell most steeply among white students, followed by African-American students.
In 2008, 31,484 students who obtained an HSE were white. By 2017, however, the number of white students obtaining an HSE fell by two-thirds to only 4,005. White students as a share of all adults obtaining an HSE declined from 38 percent to 24 percent.
The number of successful African-American students also fell sharply, from 8,667 in 2008 to 3,697 in 2017, a 57 percent drop. The number of Hispanic students obtaining an HSE fell by 45 percent to 3,916. In 2014, Hispanic HSE attainment surpassed African-American HSE attainment for the first time.
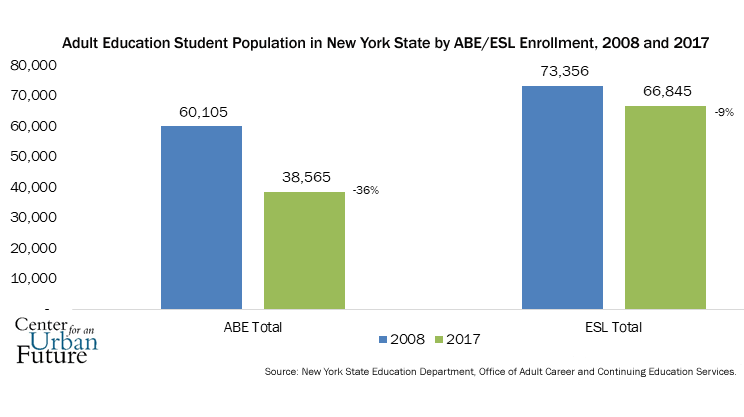
The population of adult basic education students at the high school equivalency level has declined sharply.
Between 2008 and 2017, the population of adult education students in New York dropped 21 percent, from 133,461 students to 105,410 students.
There are two branches of adult education: English for Speakers of Other Languages (ESOL), which provides instruction for foreign-born students in English-language proficiency, and adult basic education (ABE), which provides basic-skills instruction for adults who did not complete their formal K-12 education. Between 2008 and 2017, the state’s ESOL student population dropped by 9 percent, while the ABE student population fell by 36 percent.
The number of students in the highest level of adult basic education, Level 6, fell by 70 percent, from 3,826 to 1,165—the sharpest drop of any level. These students are at an 11th and 12th grade literacy level and are therefore the best candidates to take and pass a high school equivalency exam. The lack of students at the highest level of adult basic education helps to explain, in part, why fewer adults are earning a high school equivalency today.
More New Yorkers are graduating high school, but few who drop out are earning a high school equivalency diploma.
Between 2010 and 2016 (the last year for which educational attainment data is available), the number of New Yorkers lacking a high school diploma fell by 10 percent. However, the number who obtained a high school equivalency fell by 47 percent during the same period.
High school equivalency trends by region
Between 2015 and 2017, most of New York State’s ten regions saw at least slight improvements in the number of students taking the high school equivalency test. Eight out of ten regions experienced increases in test-taking, and four saw increases above 10 percent. The picture was not as bright in actual high school equivalency attainment, however. Only five regions saw increases in attainment, and only two of those regions exceeded a 10 percent increase (Mohawk Valley and North Country).
Since 2010, test-taking has dropped by 40 percent or more in six of the ten regions, and by 50 percent or more in three of them: Capital Region, Central New York, and the Southern Tier. High school equivalency attainment dropped by 60 percent or more in two regions (Capital Region and Central New York), by 50 percent or more in five regions, and by 40 percent or more in all 10 regions. The pass rate dropped 10 percentage points or more in 6 of the ten regions, led by a remarkable 17-point decline in Central New York, from 69 percent to 52 percent.
Between 2015 and 2017, the North Country saw the steepest improvement of any region, as test-taking jumped by 46 percent and HSE attainment by 35 percent.
During those same years, HSE test-taking declined most in the Capital Region (-11 percent) and Long Island (-2 percent). HSE attainment fell in five regions, with the sharpest decrease on Long Island (-16 percent).
Over the entire seven-year period between 2010 and 2017, HSE test-taking dropped most steeply on a percentage basis in Capital District (-60 percent), and on a numerical basis in New York City (-9,181).
The steepest decline in actual HSE attainment came in Central New York, which fell by 63 percent. New York City saw the greatest numerical drop, falling by 5,675 test passers, a 45 percent decrease.
Five regions have seen further declines in attainment since 2015, led by Long Island and the Capital Region. Every region of the state has seen high school equivalency attainment drop since 2010. But in five out of ten regions, attainment has declined even further since 2015: Long Island (-16 percent), Capital Region (-11 percent), Southern Tier (-7 percent), Central New York (-3 percent), and New York City (-1 percent).
Five regions have seen an increase in attainment since 2015, led by the North Country and the Mohawk Valley. In five out of ten regions, high school equivalency attainment has increased since 2015: North Country (35 percent), Mohawk Valley (16 percent), Hudson Valley (8 percent), Finger Lakes (6 percent), and Western New York (1 percent).
Capital District: HSE test-taking in the Capital District fell by 55 percent between 2010 and 2015 and a further 11 percent from 2015 to 2017, for a total decline of 60 percent over seven years. HSE attainment fell by 61 percent since 2010.
Central New York: Test-taking in the Central New York region dropped by 57 percent between 2010 and 2015 and rebounded by 13 percent from 2015 to 2017, for a total decline of 51 percent over seven years. But HSE attainment declined by 63 percent over that same period, because over those seven years, the HSE pass rate fell from 69 percent to 52 percent.
Finger Lakes: Test-taking in the Finger Lakes region dropped by 47 percent between 2010 and 2015, but recovered by 10 percent between 2015 to 2017, for a total decline of 42 percent over seven years. But HSE attainment fell by 51 percent between 2010 and 2017, due to a decline in pass rate from 67 percent to 56 percent.
Hudson Valley: Test-taking in the Hudson Valley region fell by 46 percent between 2010 and 2015, but recovered by 15 percent between 2015 to 2017, for a total decline of 37 percent over seven years. But actual HSE attainment fell by 47 percent between 2010 and 2017, due to a decline in pass rate from 64 percent to 54 percent.
Long Island: The Long Island region experienced the slowest decline in test-taking of all regions between 2010 and 2015 (-29 percent), but dropped another 2 percent between 2015 and 2017, for a total decline of 30 percent between 2010 and 2017. HSE attainment fell by 44 percent over that seven-year stretch due to a decline in pass rate from 58 percent to 47 percent.
Mohawk Valley: Test-taking in the Mohawk Valley region dropped by 52 percent between 2010 and 2015, but recovered by 25 percent between 2015 and 2017, for a total decline of 40 percent between 2010 and 2017. Actual HSE attainment fell by 48 percent over the seven-year period due to a pass rate decline from 77 percent to 67 percent.
New York City: Test-taking in New York City dropped by 42 percent between 2010 and 2015, and recovered by 9 percent between 2015 and 2017, for a total decline of 40 percent between 2010 and 2017. HSE attainment dropped slightly between 2015 and 2017 (-1 percent) and by almost half (-45 percent) over the full seven-year stretch, owing to a decline in the city’s already low pass rate from 51 percent to 44 percent.
North Country: Test-taking in the North Country region fell by 52 percent between 2010 and 2015, but then bounced back by an impressive 46 percent between 2015 and 2017, for a total decline of 30 percent between 2010 and 2017. But HSE attainment fell by 43 percent during that time period due to a pass rate decline from 78 percent to 64 percent.
Southern Tier: Test-taking in the Southern Tier region fell by 53 percent between 2010 and 2015 and increased 1 percent between 2015 and 2017, for a total decline of 52 percent between 2010 and 2017. HSE attainment fell by 57 percent due to a pass rate decline from 71 percent to 64 percent.
Western New York: Test-taking in the Western New York region dropped by 49 percent between 2010 and 2015, but recovered by 2 percent between 2015 and 2017, for a total decline of 48 percent between 2010 and 2017. HSE attainment dropped slightly faster (-52 percent) due to a modest pass rate decline from 73 percent to 67 percent.
The New York State Education Department (NYSED) is taking some steps to boost HSE attainment. In Spring 2018, the Board of Regents approved an innovative new policy to allow students to substitute a Regents Exam passing score for the relevant TASC subtest, which could accelerate attainment for students who passed at least one Regents Exam before leaving high school. NYSED is also performing extensive professional development to assist providers in transitioning from the GED to the TASC exam.
Still, rates of taking and passing the high school equivalency test remain alarmingly low. It is possible that NYSED’s new route to an HSE will help turn around the decline, at least for younger adults. But larger obstacles need to be identified and addressed. Reversing this decline will require a major new focus from Governor Cuomo and the State Legislature and a new level of investment in HSE preparation and testing and adult education.
High School Equivalency Attainment in New York by County, 2010–2017
County
2010
2015
2017
Change 2015–2017
# Change 2015–2017
Change 2010–2017
# Change 2010–2017
Albany
338
183
69
-62%
(114)
-80%
(269)
Allegany
73
31
22
-29%
(9)
-70%
(51)
Bronx
2,245
981
1,061
8%
80
-53%
(1,184)
Broome
401
181
149
-18%
(32)
-63%
(252)
Cattaraugus
233
176
187
6%
11
-20%
(46)
Cayuga
258
99
120
21%
21
-53%
(138)
Chautauqua
320
187
188
6%
11
-41%
(132)
Chemung
231
127
143
13%
16
-38%
(88)
Chenango
137
53
43
-19%
(10)
-69%
(94)
Clinton
265
90
143
59%
53
-46%
(122)
Columbia
207
92
68
-26%
(24)
-67%
(139)
Cortland
95
28
36
29%
8
-62%
(59)
Delaware
39
7
1
-86%
(6)
-97%
(38)
Dutchess
695
305
362
19%
57
-48%
(333)
Erie
1,386
643
593
-8%
(50)
-57%
(793)
Essex
91
34
59
74%
25
-35%
(32)
Franklin
301
90
169
88%
79
-44%
(132)
Fulton
179
47
105
123%
58
-41%
(74)
Genesee
196
86
43
-50%
(43)
-78%
(153)
Greene
202
122
118
-3%
(4)
-42%
(84)
Hamilton
-
-
-
-
-
-
-
Herkimer
56
29
51
76%
22
-9%
(5)
Jefferson
232
167
140
-16%
(27)
-40%
(92)
Kings
3,500
2,595
2,205
-15%
(390)
-37%
(1,295)
Lewis
-
1
1
0%
0
-
1
Livingston
108
62
85
37%
23
-21%
(23)
Madison
91
0
-
-
-
-100%
(91)
Monroe
967
462
451
-2%
(11)
-53%
(516)
Montgomery
1
0
-
-
-
-100%
(1)
Nassau
544
341
220
-35%
(121)
-60%
(324)
New York
2,366
1,356
1,482
9%
126
-37%
(884)
Niagara
355
78
137
76%
59
-61%
(218)
Oneida
596
339
373
10%
34
-37%
(223)
Onondaga
752
309
324
5%
15
-57%
(428)
Ontario
200
47
60
28%
13
-70%
(140)
Orange
567
313
342
9%
29
-40%
(225)
Orleans
157
82
89
9%
7
-43%
(68)
Oswego
138
71
13
-82%
(58)
-91%
(125)
Otsego
285
109
78
-28%
(31)
-73%
(207)
Putnam
4
0
6
-
6
50%
2
Queens
3,945
1,912
2,006
5%
94
-49%
(1,939)
Rensselaer
19
31
186
500%
155
879%
167
Richmond
661
275
288
5%
13
-56%
(373)
Rockland
133
32
113
253%
81
-15%
(20)
Saratoga
257
87
76
-13%
(11)
-70%
(181)
Schenectady
717
231
176
-24%
(55)
-75%
(541)
Schoharie
40
0
-
-
-
-100%
(40)
Schuyler
58
0
-
-
-
-100%
(58)
Seneca
107
62
110
77%
48
3%
3
St. Lawrence
285
112
157
40%
45
-45%
(128)
Steuben
82
42
23
-45%
(19)
-72%
(59)
Suffolk
634
445
440
-1%
(5)
-31%
(194)
Sullivan
316
115
99
-14%
(16)
-69%
(217)
Tioga
9
4
6
50%
2
-33%
(3)
Tompkins
174
80
96
20%
16
-45%
(78)
Ulster
378
187
158
-16%
(29)
-58%
(220)
Warren
213
72
39
-46%
(33)
-82%
(174)
Washington
106
71
61
-14%
(10)
-42%
(45)
Wayne
128
44
70
59%
26
-45%
(58)
Westchester
895
503
494
-2%
(9)
-45%
(401)
Wyoming
107
90
83
-8%
(7)
-22%
(24)
Yates
2
3
3
0%
0
50%
1
New York State
28,077
14,321
14,420
1%
99
-49%
(13,657)
High School Equivalency Attainment in New York by Region, 2010–2017
Region
2010
2015
2017
Change 2015–2017
# Change 2015–2017
Change 2010–2017
# Change 2010–2017
Capital District
2,059
889
793
-11%
(96)
-61%
(1,266)
Central New York
1,334
507
493
-3%
(14)
-63%
(841)
Finger Lakes
2,030
938
994
6%
56
-51%
(1,036)
Hudson Valley
2,988
1,455
1,574
8%
119
-47%
(1,414)
Long Island
1,178
786
660
-16%
(126)
-44%
(518)
Mohawk Valley
1,157
524
607
16%
83
-48%
(550)
New York City
12,717
7,119
7,042
-1%
(77)
-45%
(5,675)
North Country
1,174
494
669
35%
175
-43%
(505)
Southern Tier
1,073
494
461
-7%
(33)
-57%
(612)
Western New York
2,367
1,115
1,127
1%
12
-52%
(1,240)
New York State
28,077
14,321
14,420
1%
99
-49%
(13,657)
High School Equivalency Attainment in the United States, 2012–2016
State
Completed Test 2012
Completed Test 2016
Completed Change %
2012–2016
Pass 2012
Pass 2016
Pass Change % 2012–2016
Pass Rate 2012
Pass Rate 2016
Alabama
14,622
3,599
-75.4%
7,967
2,709
-66%
54%
75%
Alaska
1,792
834
-53.5%
1,558
735
-53%
87%
88%
Arizona
16,000
7,162
-55.2%
11,588
5,860
-49%
72%
82%
Arkansas
7,521
4,213
-44.0%
6,346
3,712
-42%
84%
88%
California
44,231
26,167
-40.8%
30201
19,969
-34%
68%
76%
Colorado
11,369
5,313
-53.3%
9,376
4,532
-52%
82%
85%
Connecticut
4,755
1,482
-68.8%
2,712
973
-64%
57%
66%
Delaware
786
578
-26.5%
724
445
-39%
92%
77%
District of Columbia
801
464
-42.1%
442
265
-40%
55%
57%
Florida
41,991
24,239
-42.3%
28,442
19,293
-32%
68%
80%
Georgia
24,053
13,581
-43.5%
15,980
10,178
-36%
66%
75%
Hawaii
1,563
515
-67.1%
1,210
466
-61%
77%
90%
Idaho
3,714
2,284
-38.5%
3,191
1,973
-38%
86%
86%
Illinois
24,508
9,502
-61.2%
14,735
7,283
-51%
60%
77%
Indiana
14,445
8,411
-41.8%
10,759
6396
-41%
74%
76%
Iowa
3,324
1,893
-43.1%
3,251
1834
-44%
98%
97%
Kansas
3,009
2,383
-20.8%
2,806
1,977
-30%
93%
83%
Kentucky
11,447
3,883
-66.1%
8,888
3,300
-63%
78%
85%
Louisiana
10,789
6,608
-38.8%
7,281
5,299
-27%
67%
80%
Maine
2,259
1,225
-45.8%
1,878
1108
-41%
83%
90%
Maryland
8,130
4,943
-39.2%
4,802
3,400
-29%
59%
69%
Massachusetts
10,692
5,830
-45.5%
6,630
4,707
-29%
62%
81%
Michigan
14,760
5,285
-64.2%
10,290
4,059
-61%
70%
77%
Minnesota
6,859
3,460
-49.6%
5,562
2,854
-49%
81%
82%
Mississippi
11,205
3,606
-67.8%
6,196
2,578
-58%
55%
71%
Missouri
12,355
8,690
-29.7%
9,222
7628
-17%
75%
88%
Montana
2,791
1,764
-36.8%
2,165
1,516
-30%
78%
86%
Nebraska
2,355
825
-65.0%
1,874
699
-63%
80%
85%
Nevada
5,729
3,812
-33.5%
4,012
2841
-29%
70%
75%
New Hampshire
1,740
1,016
-41.6%
1,450
934
-36%
83%
92%
New Jersey
13,198
7,075
-46.4%
7,808
4670
-40%
59%
66%
New Mexico
6,896
4,298
-37.7%
4,492
3,431
-24%
65%
80%
New York
43,168
25,189
-41.6%
23,223
13629
-41%
54%
54%
North Carolina
14,070
7,173
-49.0%
11,935
5,718
-52%
85%
80%
North Dakota
1,143
750
-34.4%
982
668
-32%
86%
89%
Ohio
19,241
9,027
-53.1%
13,248
6,711
-49%
69%
74%
Oregon
9,388
6,232
-33.6%
7,892
5,433
-31%
84%
87%
Pennsylvania
18,447
7,215
-60.9%
12,996
5,709
-56%
70%
79%
Rhode Island
2,059
755
-63.3%
1,560
617
-60%
76%
82%
South Carolina
10,375
5,087
-51.0%
7,479
4,229
-43%
72%
83%
South Dakota
953
689
-27.7%
644
617
-4%
68%
90%
Tennessee
13,252
7,855
-40.7%
8,901
5979
-33%
67%
76%
Texas
44,369
39,797
-10.3%
29,938
21,430
-28%
67%
54%
Utah
6,902
2,840
-58.9%
5,639
2,447
-57%
82%
86%
Vermont
568
179
-68.5%
480
157
-67%
85%
88%
Virginia
16,644
5,278
-68.3%
10,914
4,194
-62%
66%
79%
Washington
15,938
6,799
-57.3%
12,987
5,790
-55%
81%
85%
West Virginia
5,270
3,227
-38.8%
4,028
2486
-38%
76%
77%
Wisconsin
9,334
3,510
-62.4%
7,110
2,859
-60%
76%
81%
Wyoming
1,344
1,154
-14.1%
1,223
1,060
-13%
91%
92%
Oklahoma
8,866
6,391
Multi-State Group
572,154
307,696
-46.2%
395,017
227,357
-42%
69%
74%
State(s)
Complete 2012
Complete 2016
Complete Change % 2012–2016
Pass 2012
Pass 2016
Pass Change % 2012–2016
Pass Rate 2012
Pass Rate 2016
All States Excluding New York
528,986
282,507
-46.6%
371,794
213,728
-43%
70%
76%
New York
43,168
25,189
-41.6%
23,223
13629
-41%
54%
54%
1. Note that because comparative pass rate data is derived from the annual reports of the TASC and HiSET preparers, New York testing and passing data will differ slightly than other data used in this study.
2. This analysis excludes Oklahoma, which did not provide data for this study. Our national estimate accounts for 96 percent of the HSE-eligible population in the country.
General operating support for the Center for an Urban Future has been provided by The Clark Foundation, the Bernard F. and Alva B. Gimbel Foundation, and the Altman Foundation. Additional support provided by the Working Poor Families Project, a national initiative supported by the Annie E. Casey and Joyce Foundations, which partners with nonprofit organizations in 23 states to investigate policies that could better prepare working families for a more secure economic future. CUF is also grateful for support from Fisher Brothers for the Middle Class Jobs Project. CUF is also grateful for the assistance of Working Poor Families Project affiliate groups in sourcing HSE data from their respective states.
"Out of Reach: Too Few New Yorkers Are Earning a High School Equivalency Diploma" is a publication of the Center for an Urban Future. Researched and written by Senior Fellow for Economic Opportunity Tom Hilliard. Edited by Eli Dvorkin and Jonathan Bowles. Additional research by Jason Goldberg and Arielle Rutledge.
Center for an Urban Future (CUF) is an independent, nonprofit think tank that generates innovative policies to create jobs, reduce inequality and help lower income New Yorkers climb into the middle class. For 20 years, CUF has published accessible, data-driven reports on ways to grow and diversify the economy and expand opportunity that are anchored in rigorous research, not preconceived notions about outcome. Our work has been a powerful catalyst for policy change in New York City and serves as an invaluable resource for government officials, community groups, nonprofit practitioners and business leaders as they advocate for and implement policies to address some of New York’s biggest challenges and opportunities.
General operating support for the Center for an Urban Future has been provided by The Clark Foundation, the Bernard F. and Alva B. Gimbel Foundation, and the Altman Foundation. Additional support provided by the Working Poor Families Project, and from Fisher Brothers for the Middle Class Jobs Project.


 The high school equivalency pass rate has fallen since introduction of the TASC.
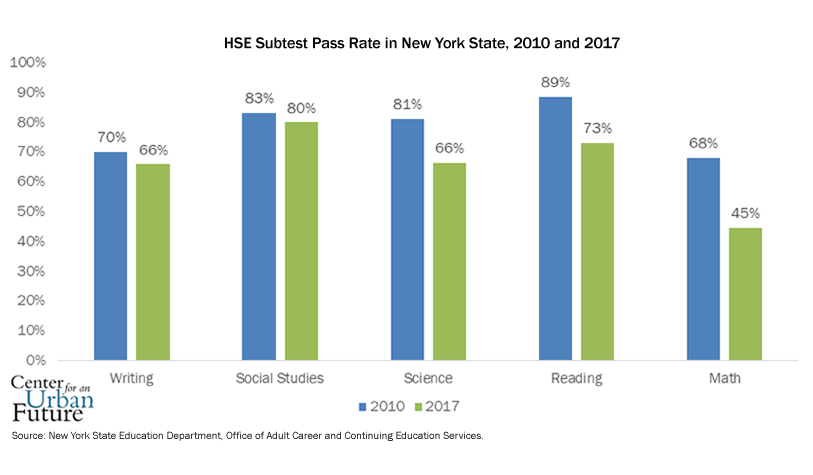
.png) The population of adult basic education students at the high school equivalency level has declined sharply.
The population of adult basic education students at the high school equivalency level has declined sharply.