Bearing the Brunt: Where NYC’s Hard-Hit Sector Workers Live
While coronavirus has devastated much of NYC's economy, our research shows that the impacts are not equally dispersed across the city: workers in the most hard-hit sectors—including restaurants, hotels, retail, and personal care services—predominantly live in lower-income neighborhoods outside Manhattan.
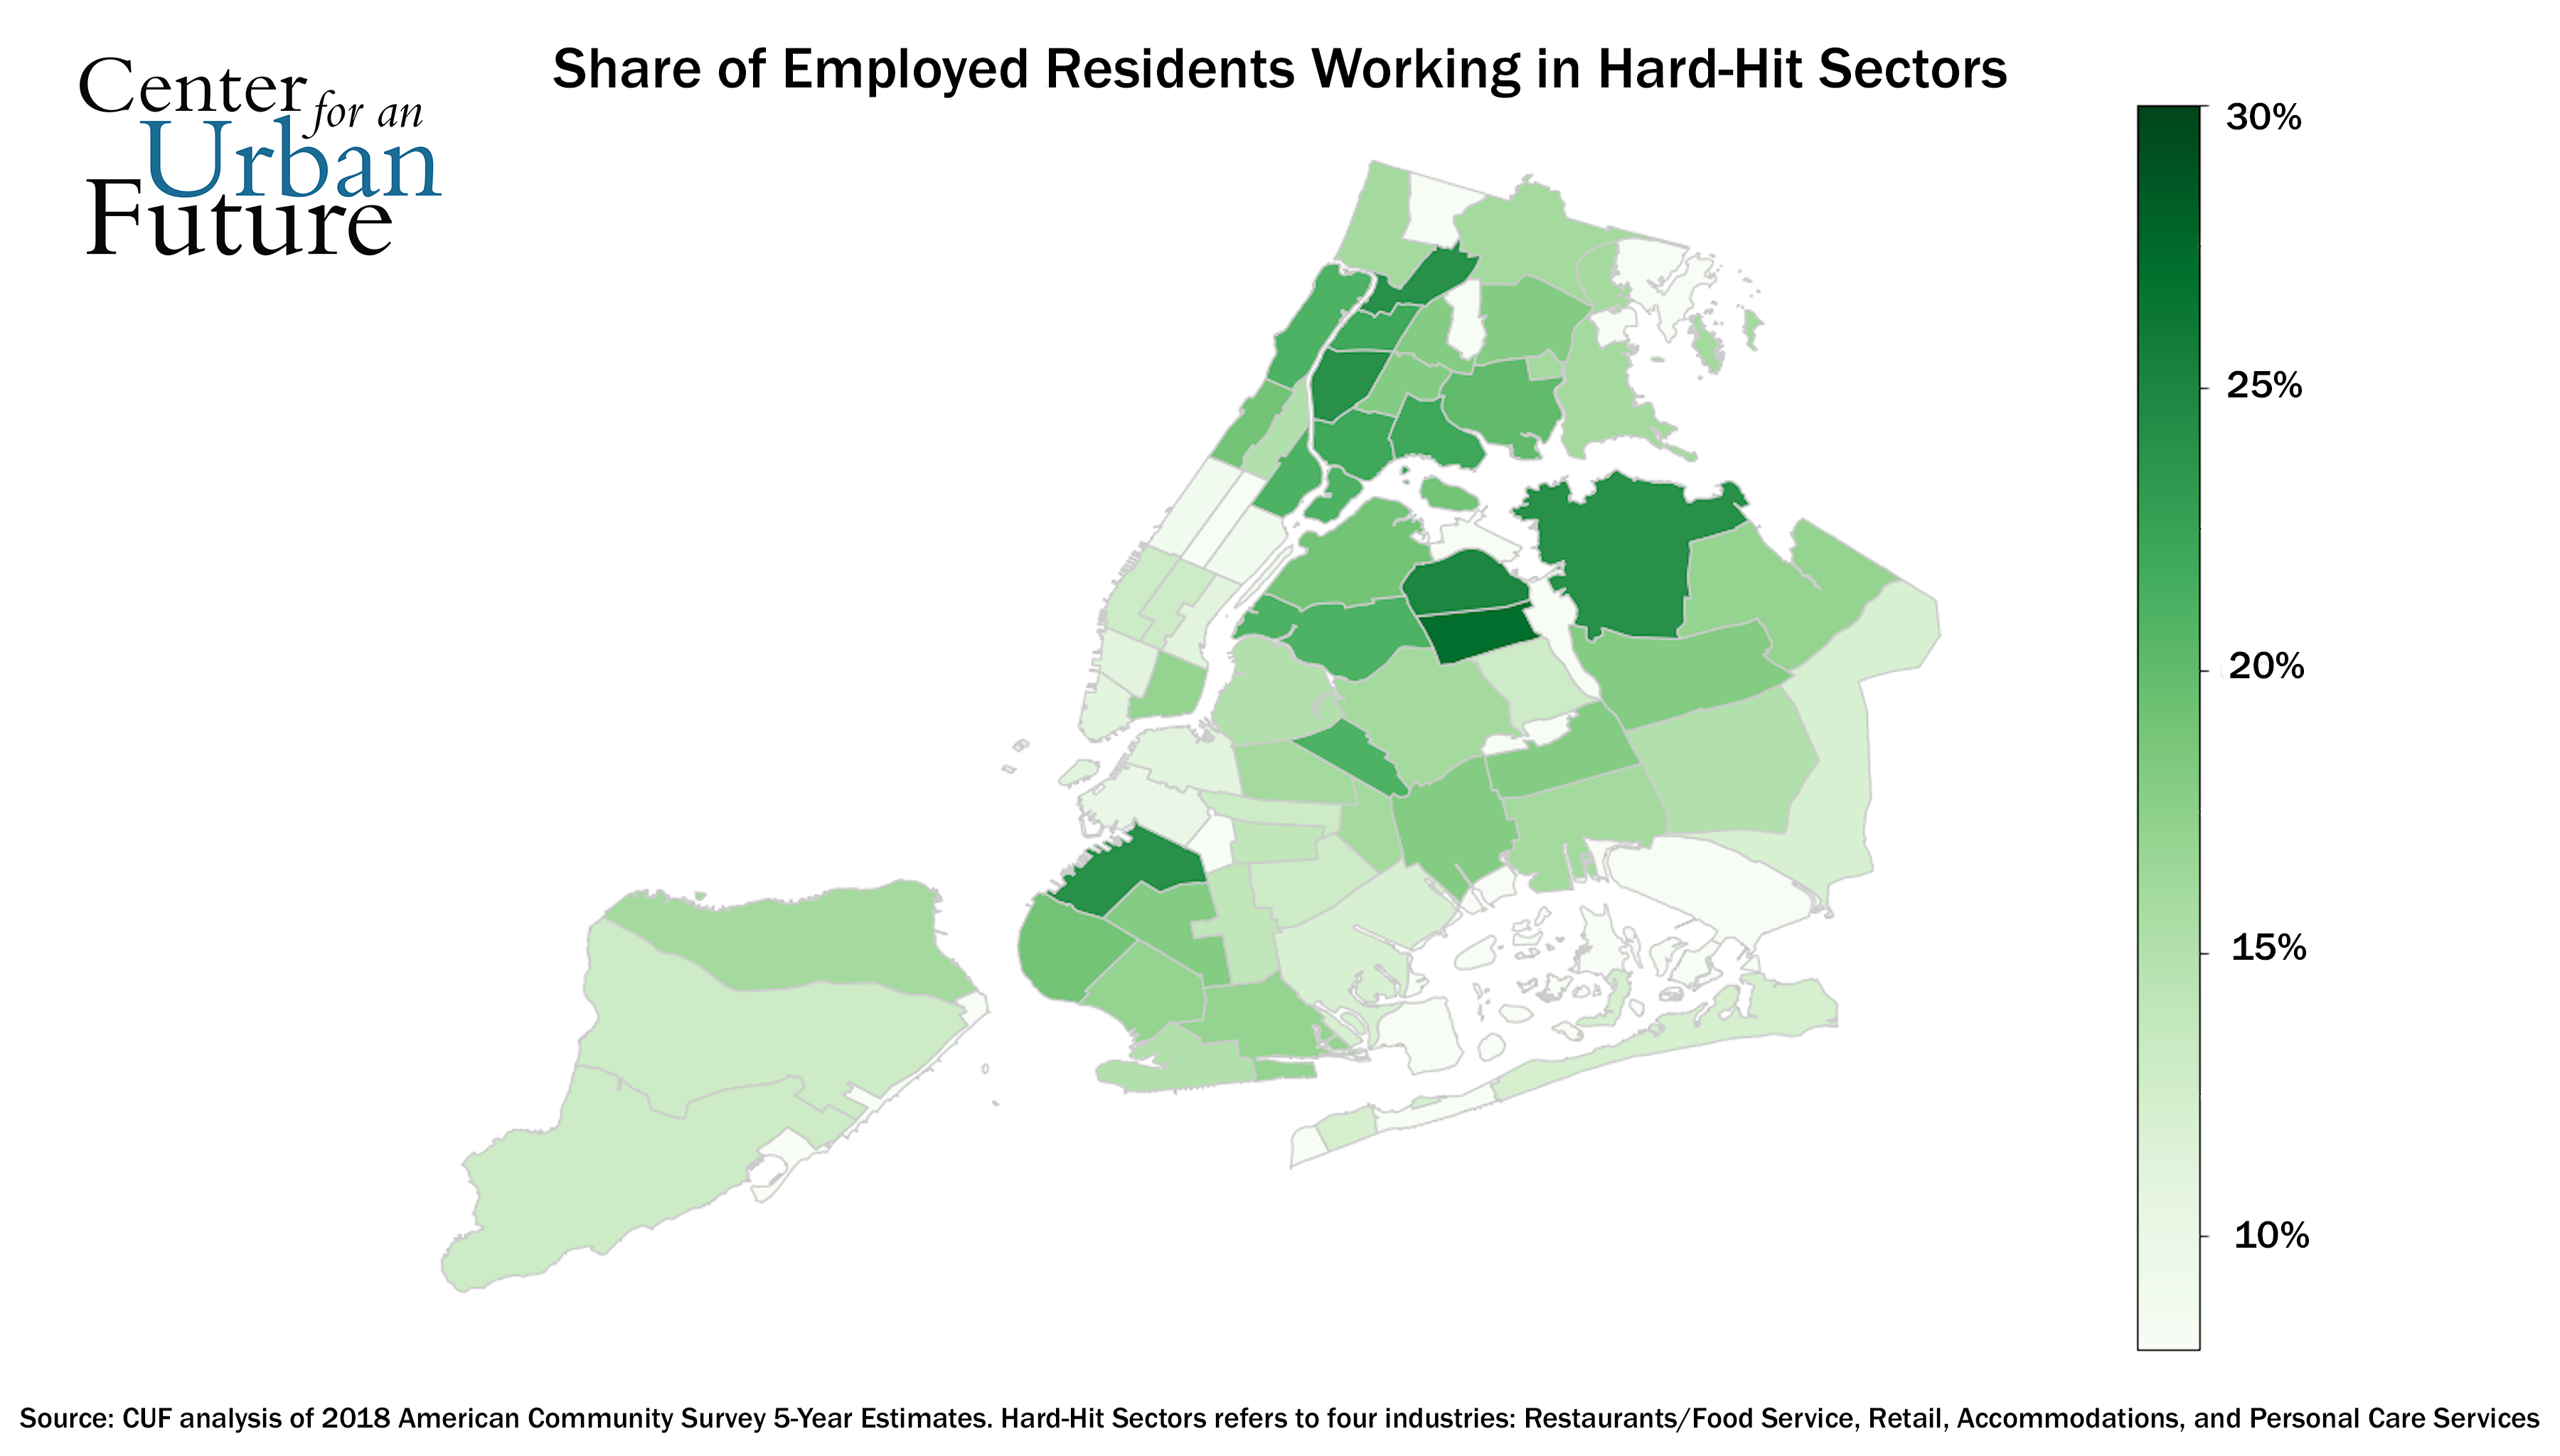
The coronavirus pandemic has brought the economy to a halt in neighborhoods throughout New York City, affecting cooks working at East Village restaurants, porters at Times Square hotels, cashiers at souvenir shops outside Yankee Stadium, and manicurists at nail salons in Brooklyn Heights. But a closer look at where New York’s workforce lives suggests that the economic devastation from this crisis has not been equally dispersed across the city. While fewer than 10 percent of residents on the Upper East Side and Park Slope work in the four industries where layoffs have been most prevalent—restaurants, hotels, retail, and personal care services—the share is 27 percent in Elmhurst, 25 percent in Corona, and 24 percent in Norwood, Highbridge, Sunset Park, and Flushing.1
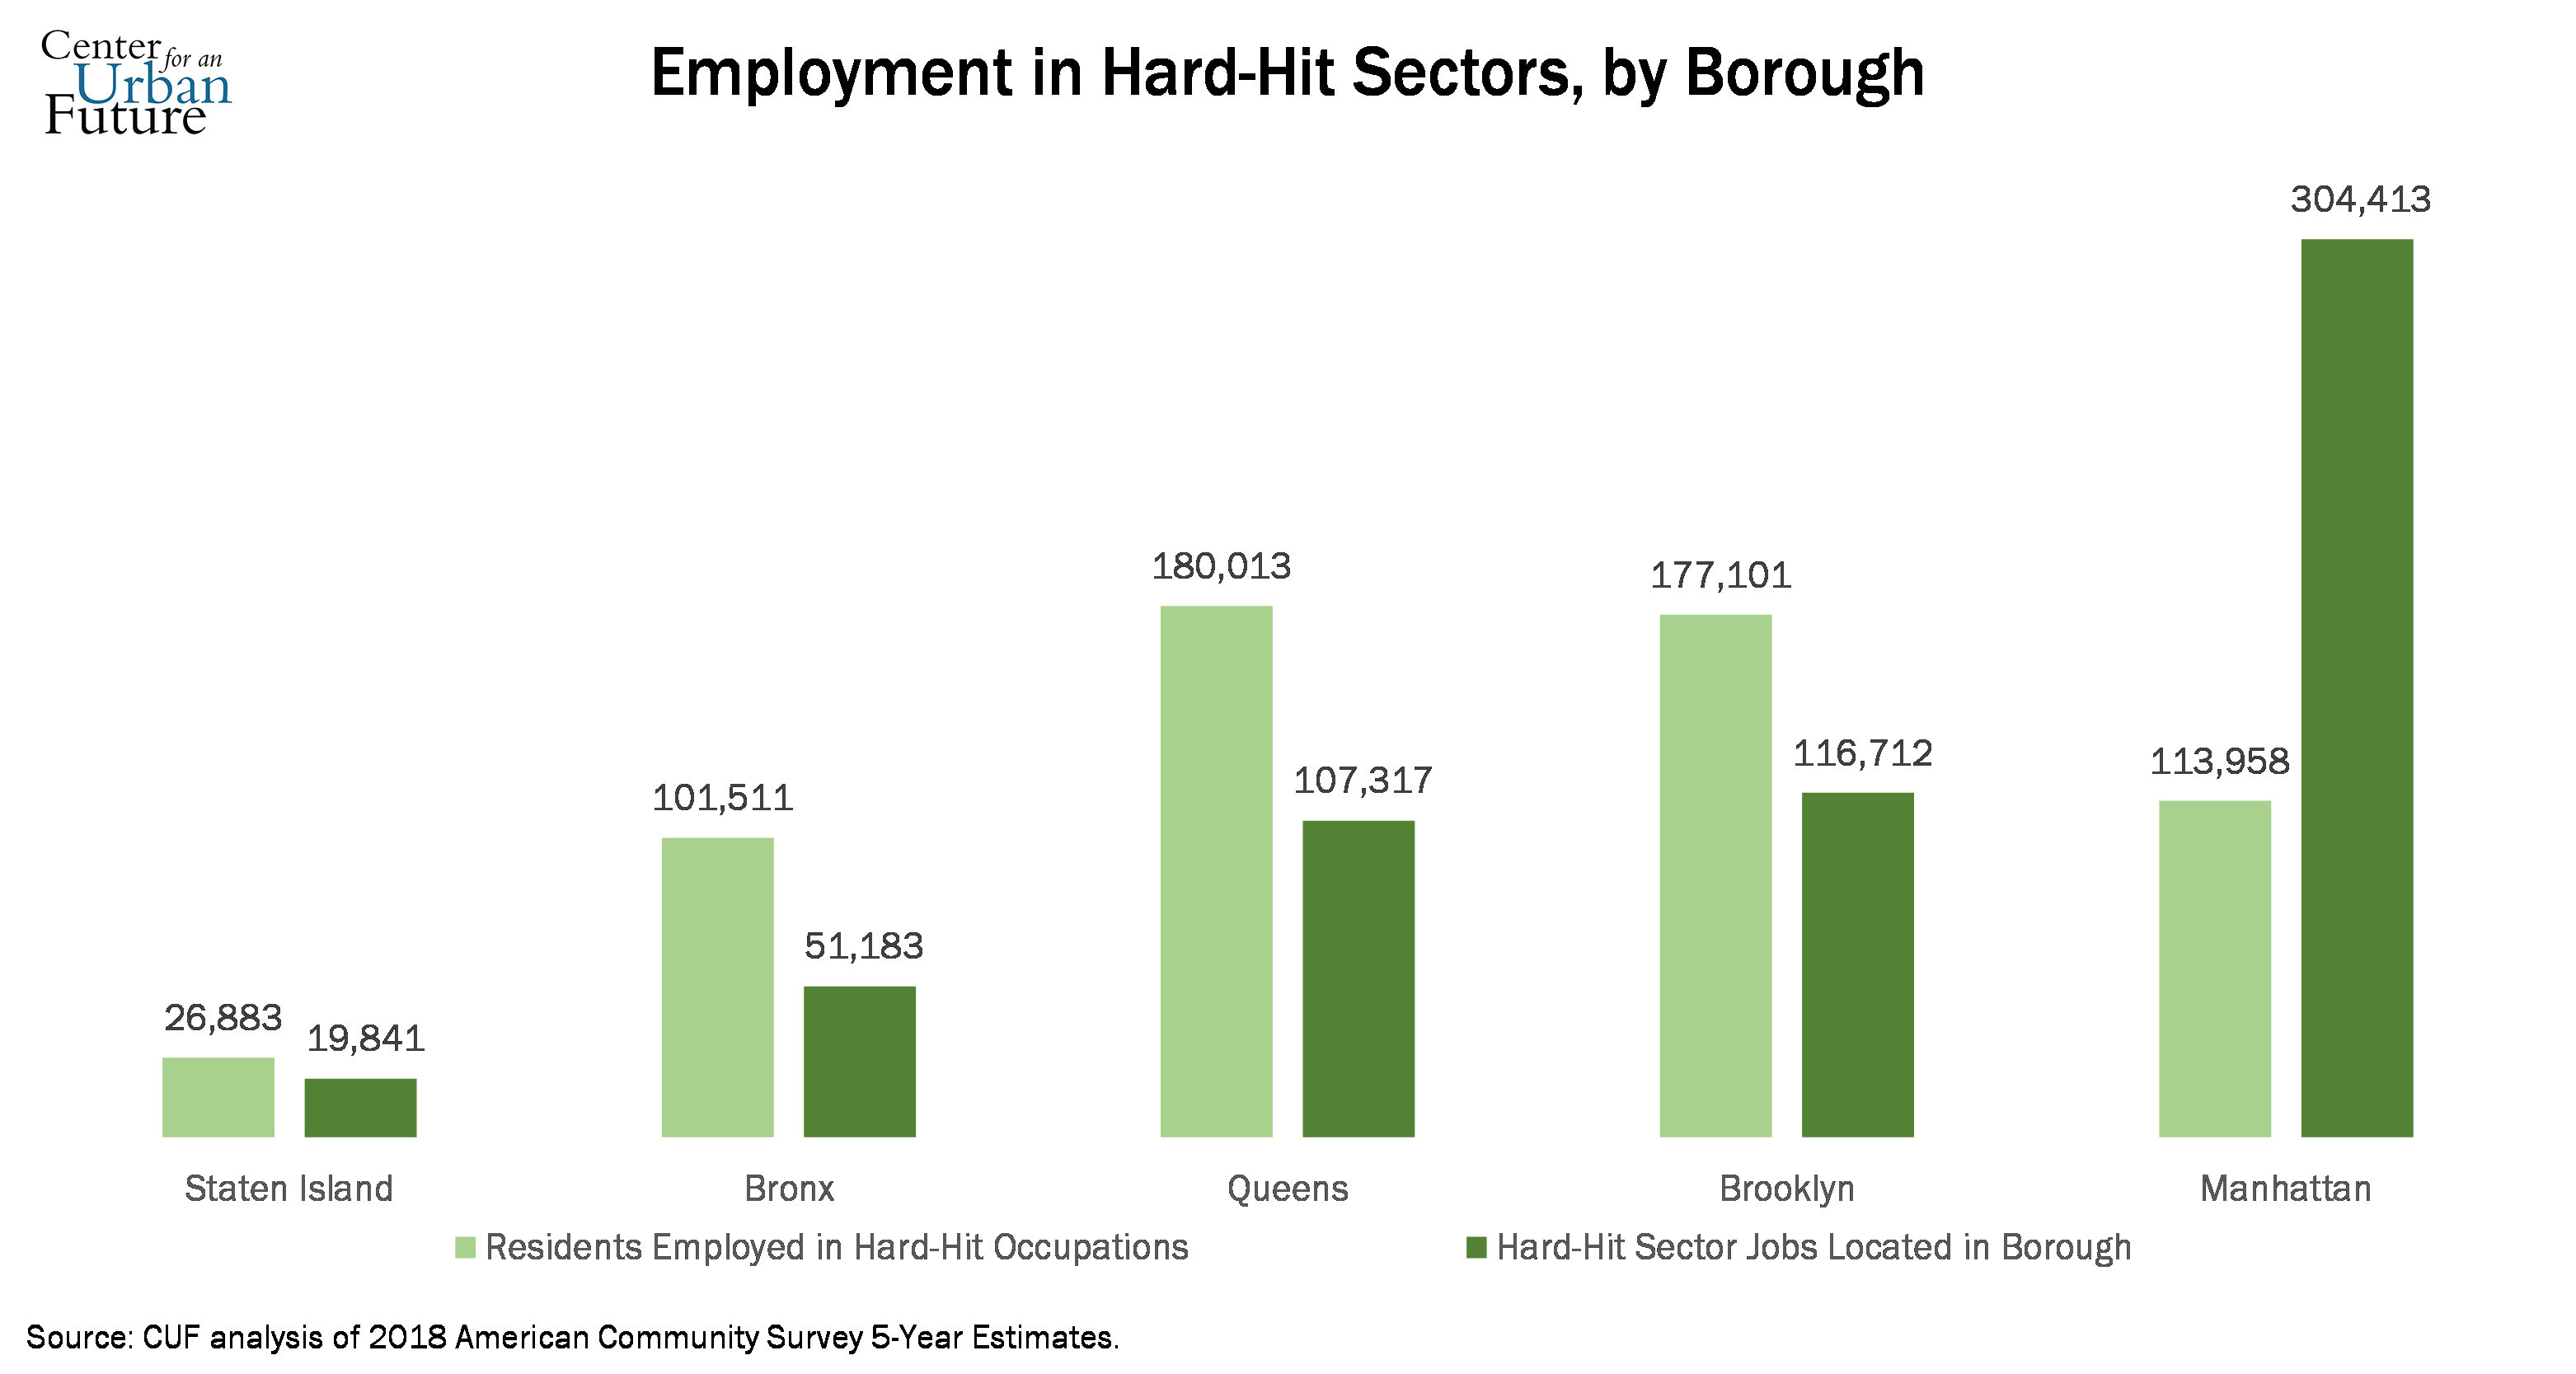
In fact, while more than half of the jobs (51 percent) in these four hard-hit industries are physically located in Manhattan, 81 percent of the workers in these sectors live in the four other boroughs. As one example, 101,511 Bronx residents work in these fields, though the borough is home to barely half the jobs (51,183).
The neighborhoods with the greatest share of residents working in these hard-hit sectors are all located either in Queens, the Bronx, Brooklyn, and Northern Manhattan—and all have a much higher share of non-white residents than the city average. For instance, in the two neighborhoods with the greatest share of residents working in these sectors—Elmhurst/South Corona and Jackson Heights/North Corona—90 percent or more of the population is non-white and over 60 percent is foreign born.2
Overall, there are 13 neighborhoods (out of 55 Census-defined neighborhoods in the city) where at least 20 percent of the working residents are employed in these industries. Four are in the Bronx, four are in Queens, two are in Brooklyn, and two are in Northern Manhattan. In all 13 of the neighborhoods, at least 71 percent of the population is non-white. In 5 of the 13, at least 90 percent is non-white. And in 9 of the 13, at least 45 percent is foreign-born. In contrast, in each of the five neighborhoods with the lowest share of residents working in these four industries, the population is at least 64 percent white and no more than 25 percent foreign born.
Other findings include:
The 10 neighborhoods with the greatest share of residents employed in the four hard-hit industries are:
Elmhurst/South Corona – 27%
North Corona/Jackson Heights – 25%
Norwood/Bedford Park/Fordham North – 24%
Highbridge/Concourse/Mount Eden – 24%
Sunset Park/Windsor Terrace – 24%
Flushing/Whitestone/Murray Hill – 24%
Morris Heights/Fordham South/Mount Hope – 22%
Hunts Point/Longwood/Melrose – 22%
Woodside/Sunnyside – 21%
East Harlem – 21%
The 10 neighborhoods with the lowest share of residents employed in the four hard-hit industries are:
Upper West Side / West Side – 9%
Upper East Side – 9%
Park Slope/Carroll Gardens/Red Hook – 10%
Midtown East/Murray Hill/Gramercy/Stuyvesant Town – 11%
Soho/Greenwich Village/Battery Park City – 11%
Brooklyn Heights/Fort Greene – 11%
Queens Village/Cambria Heights/Rosedale – 12%
Canarsie/Flatlands – 12%
Breezy Point/Broad Channel/Far Rockaway – 12%
Chelsea/Midtown – 13%
In raw numbers, Flushing has the most residents (23,076) employed in the four sectors, followed by Washington Heights (20,331) and Corona (19,442).
Whereas 304,413 jobs in these four hard-hit sectors are physically located in Manhattan, a much lower number of Manhattan residents (113,958) are employed in these industries.
Our complete findings by neighborhood are included in interactive, sortable tables at the end of this report.
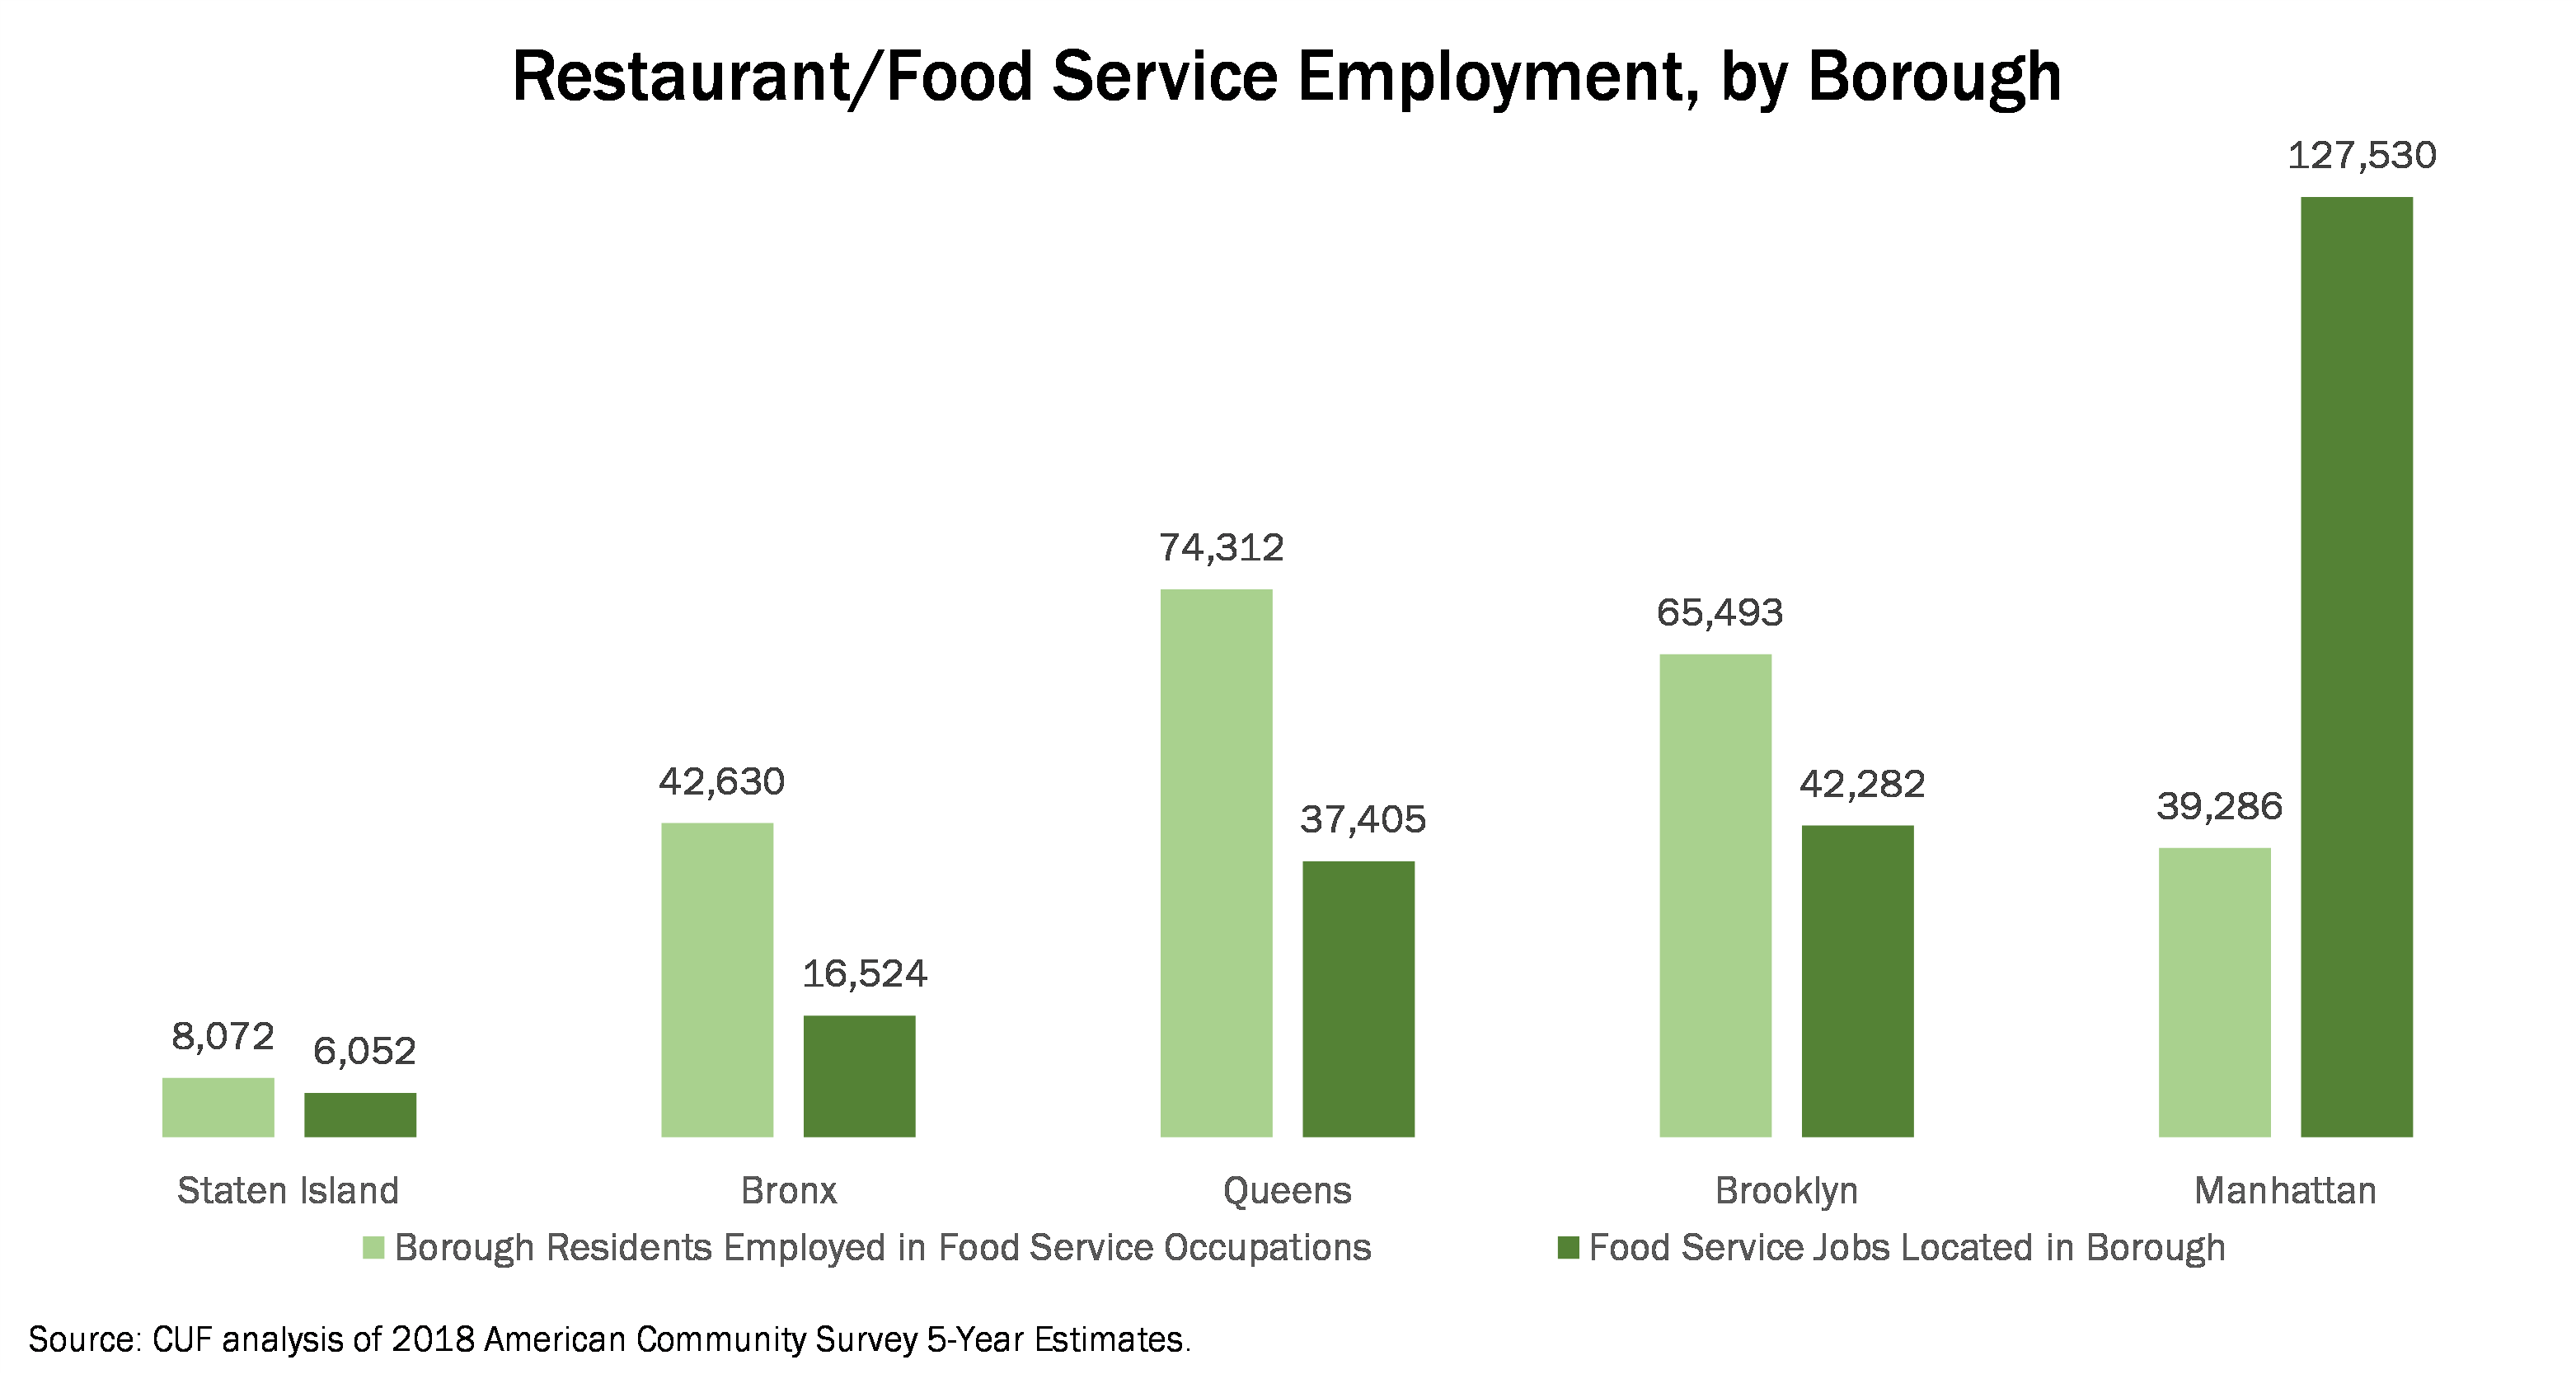
Where NYC restaurant workers live
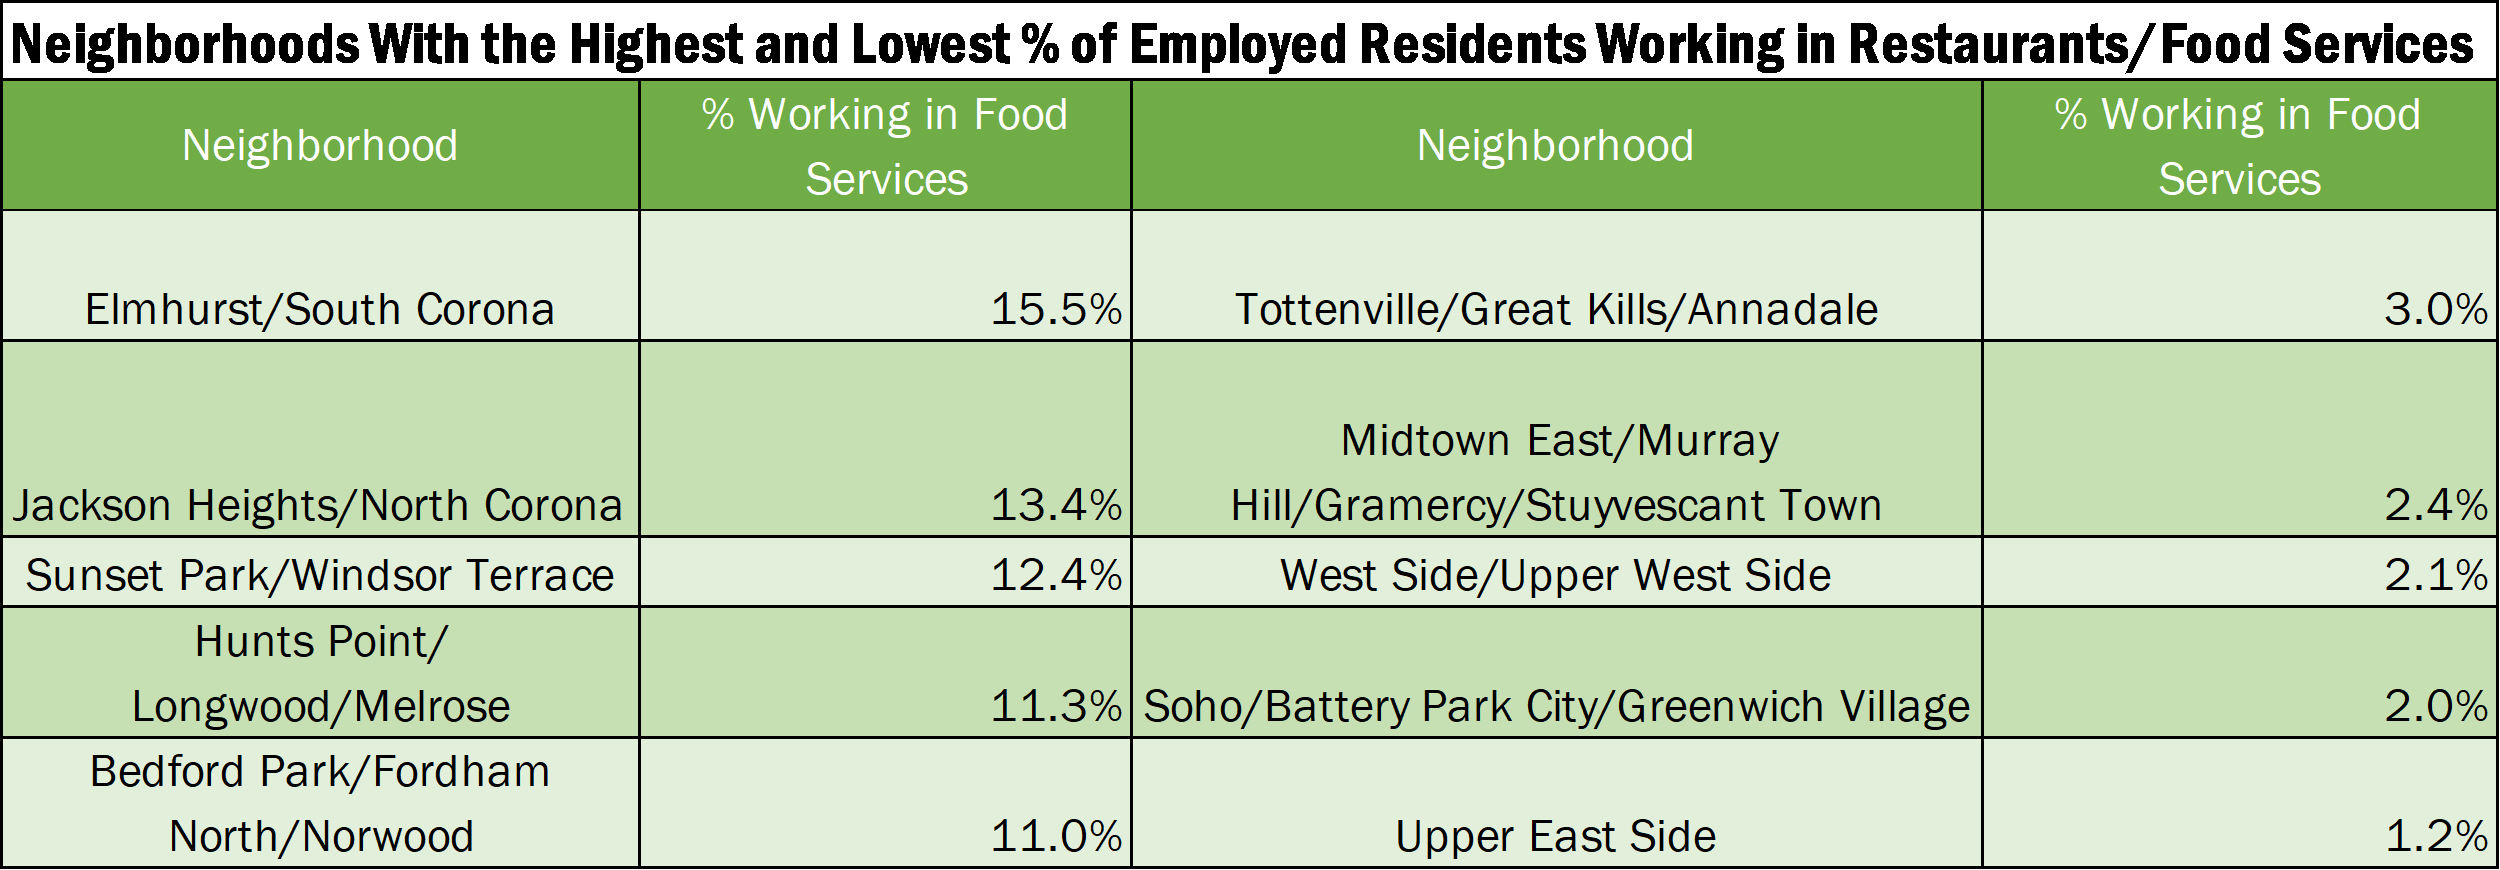
16 percent of Elmhurst residents work at restaurants and bars, the highest share of any neighborhood in the city. Other neighborhoods with a large share of residents working in this sector include Corona (13 percent), Sunset Park (12 percent), Hunts Point (11 percent), and Norwood (11 percent).
In contrast, just 1 percent of Upper East Side residents work in the restaurants sector. The workforce share is similarly low in Greenwich Village (2 percent), Upper West Side (2 percent), Midtown East (2 percent) and Tottenville (3 percent).
In overall numbers, Corona has the most residents working in the restaurants sector (10,593). Washington Heights has the next highest total (9,953).
56 percent of all restaurant jobs in the city (127,530) are physically located in Manhattan, but only 17 percent of the sector’s workforce lives in Manhattan (39,286). In contrast, roughly a third of restaurant workers live in Queens (32 percent – or 74,312 workers) even though the borough has just 16 percent of restaurant jobs (37,405).
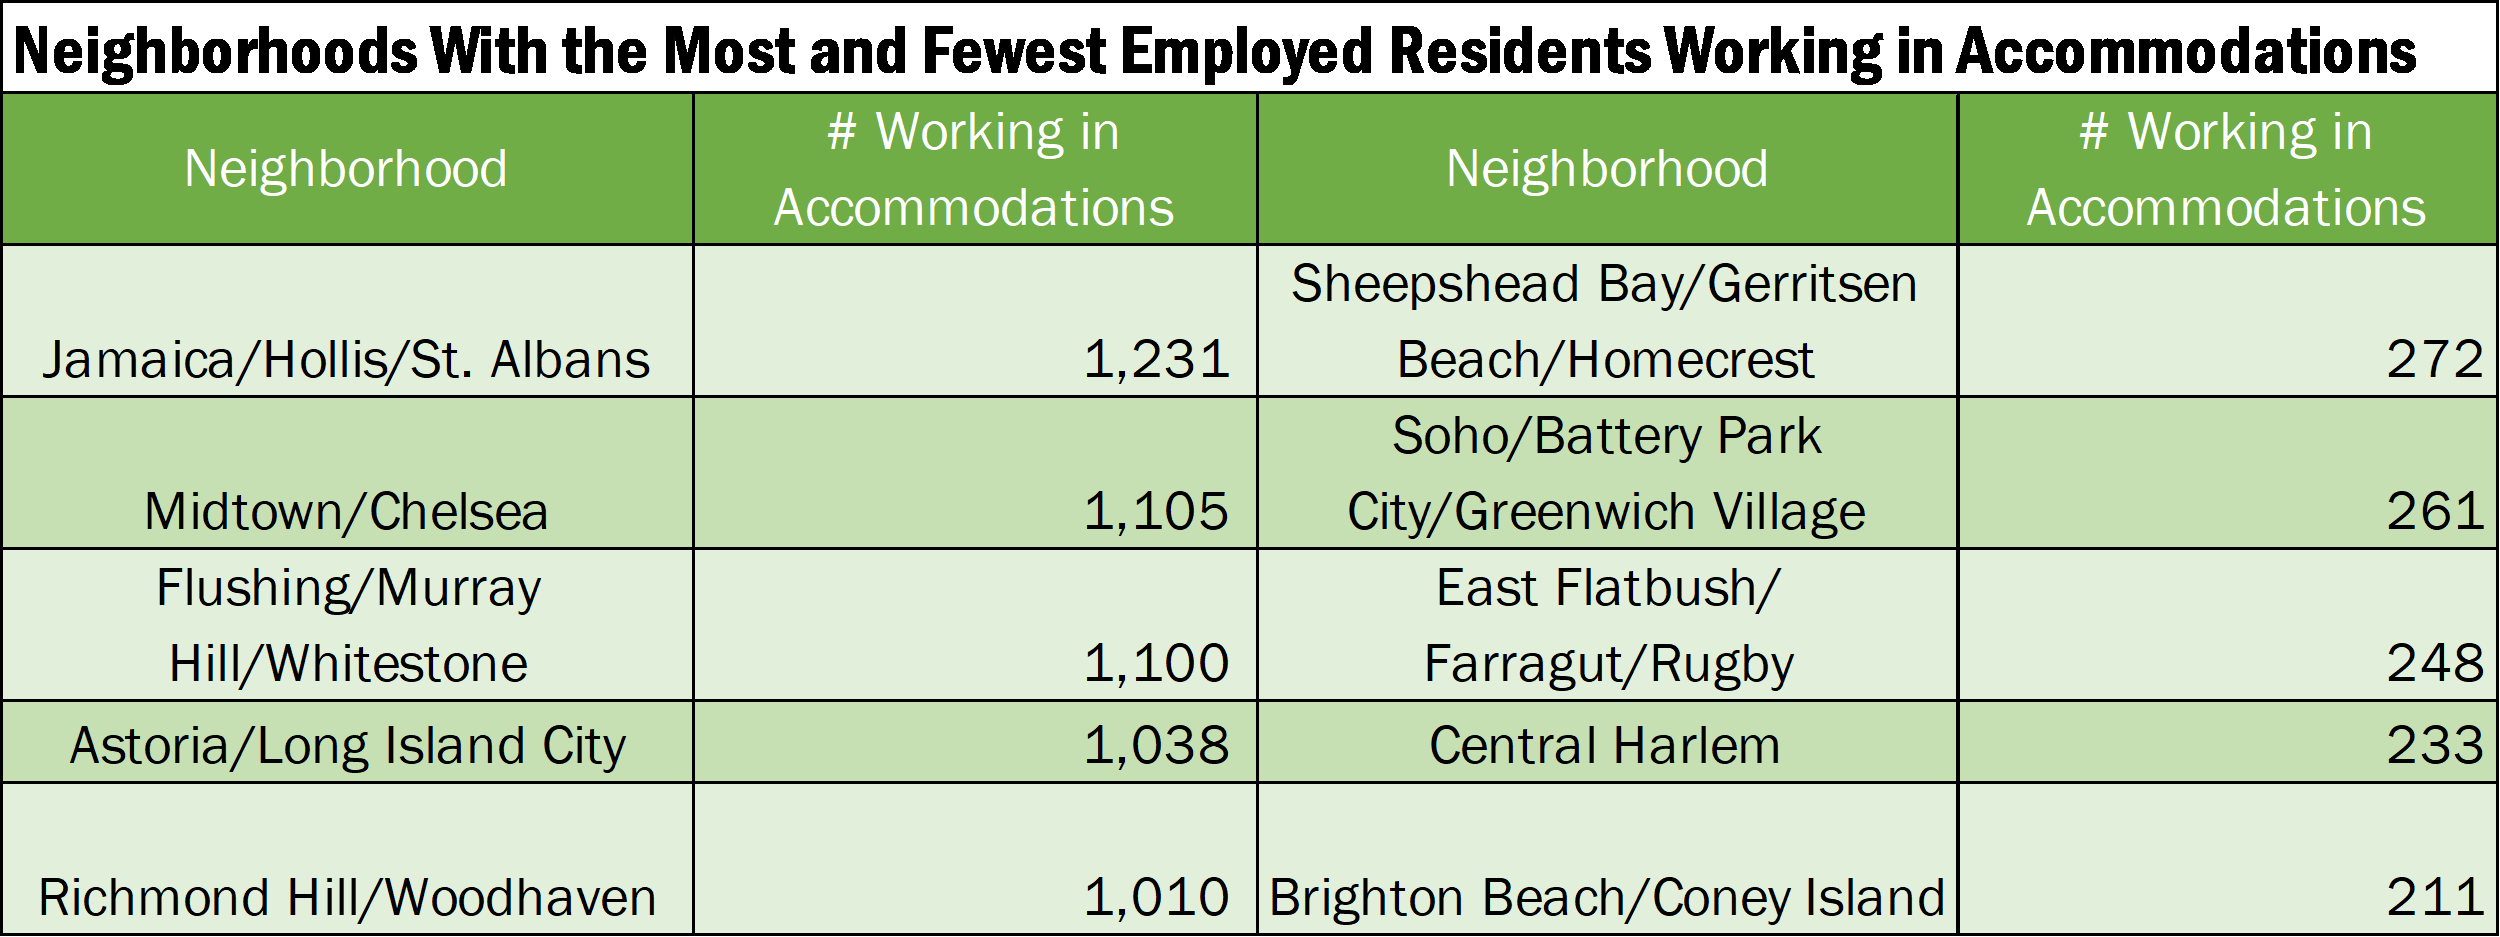
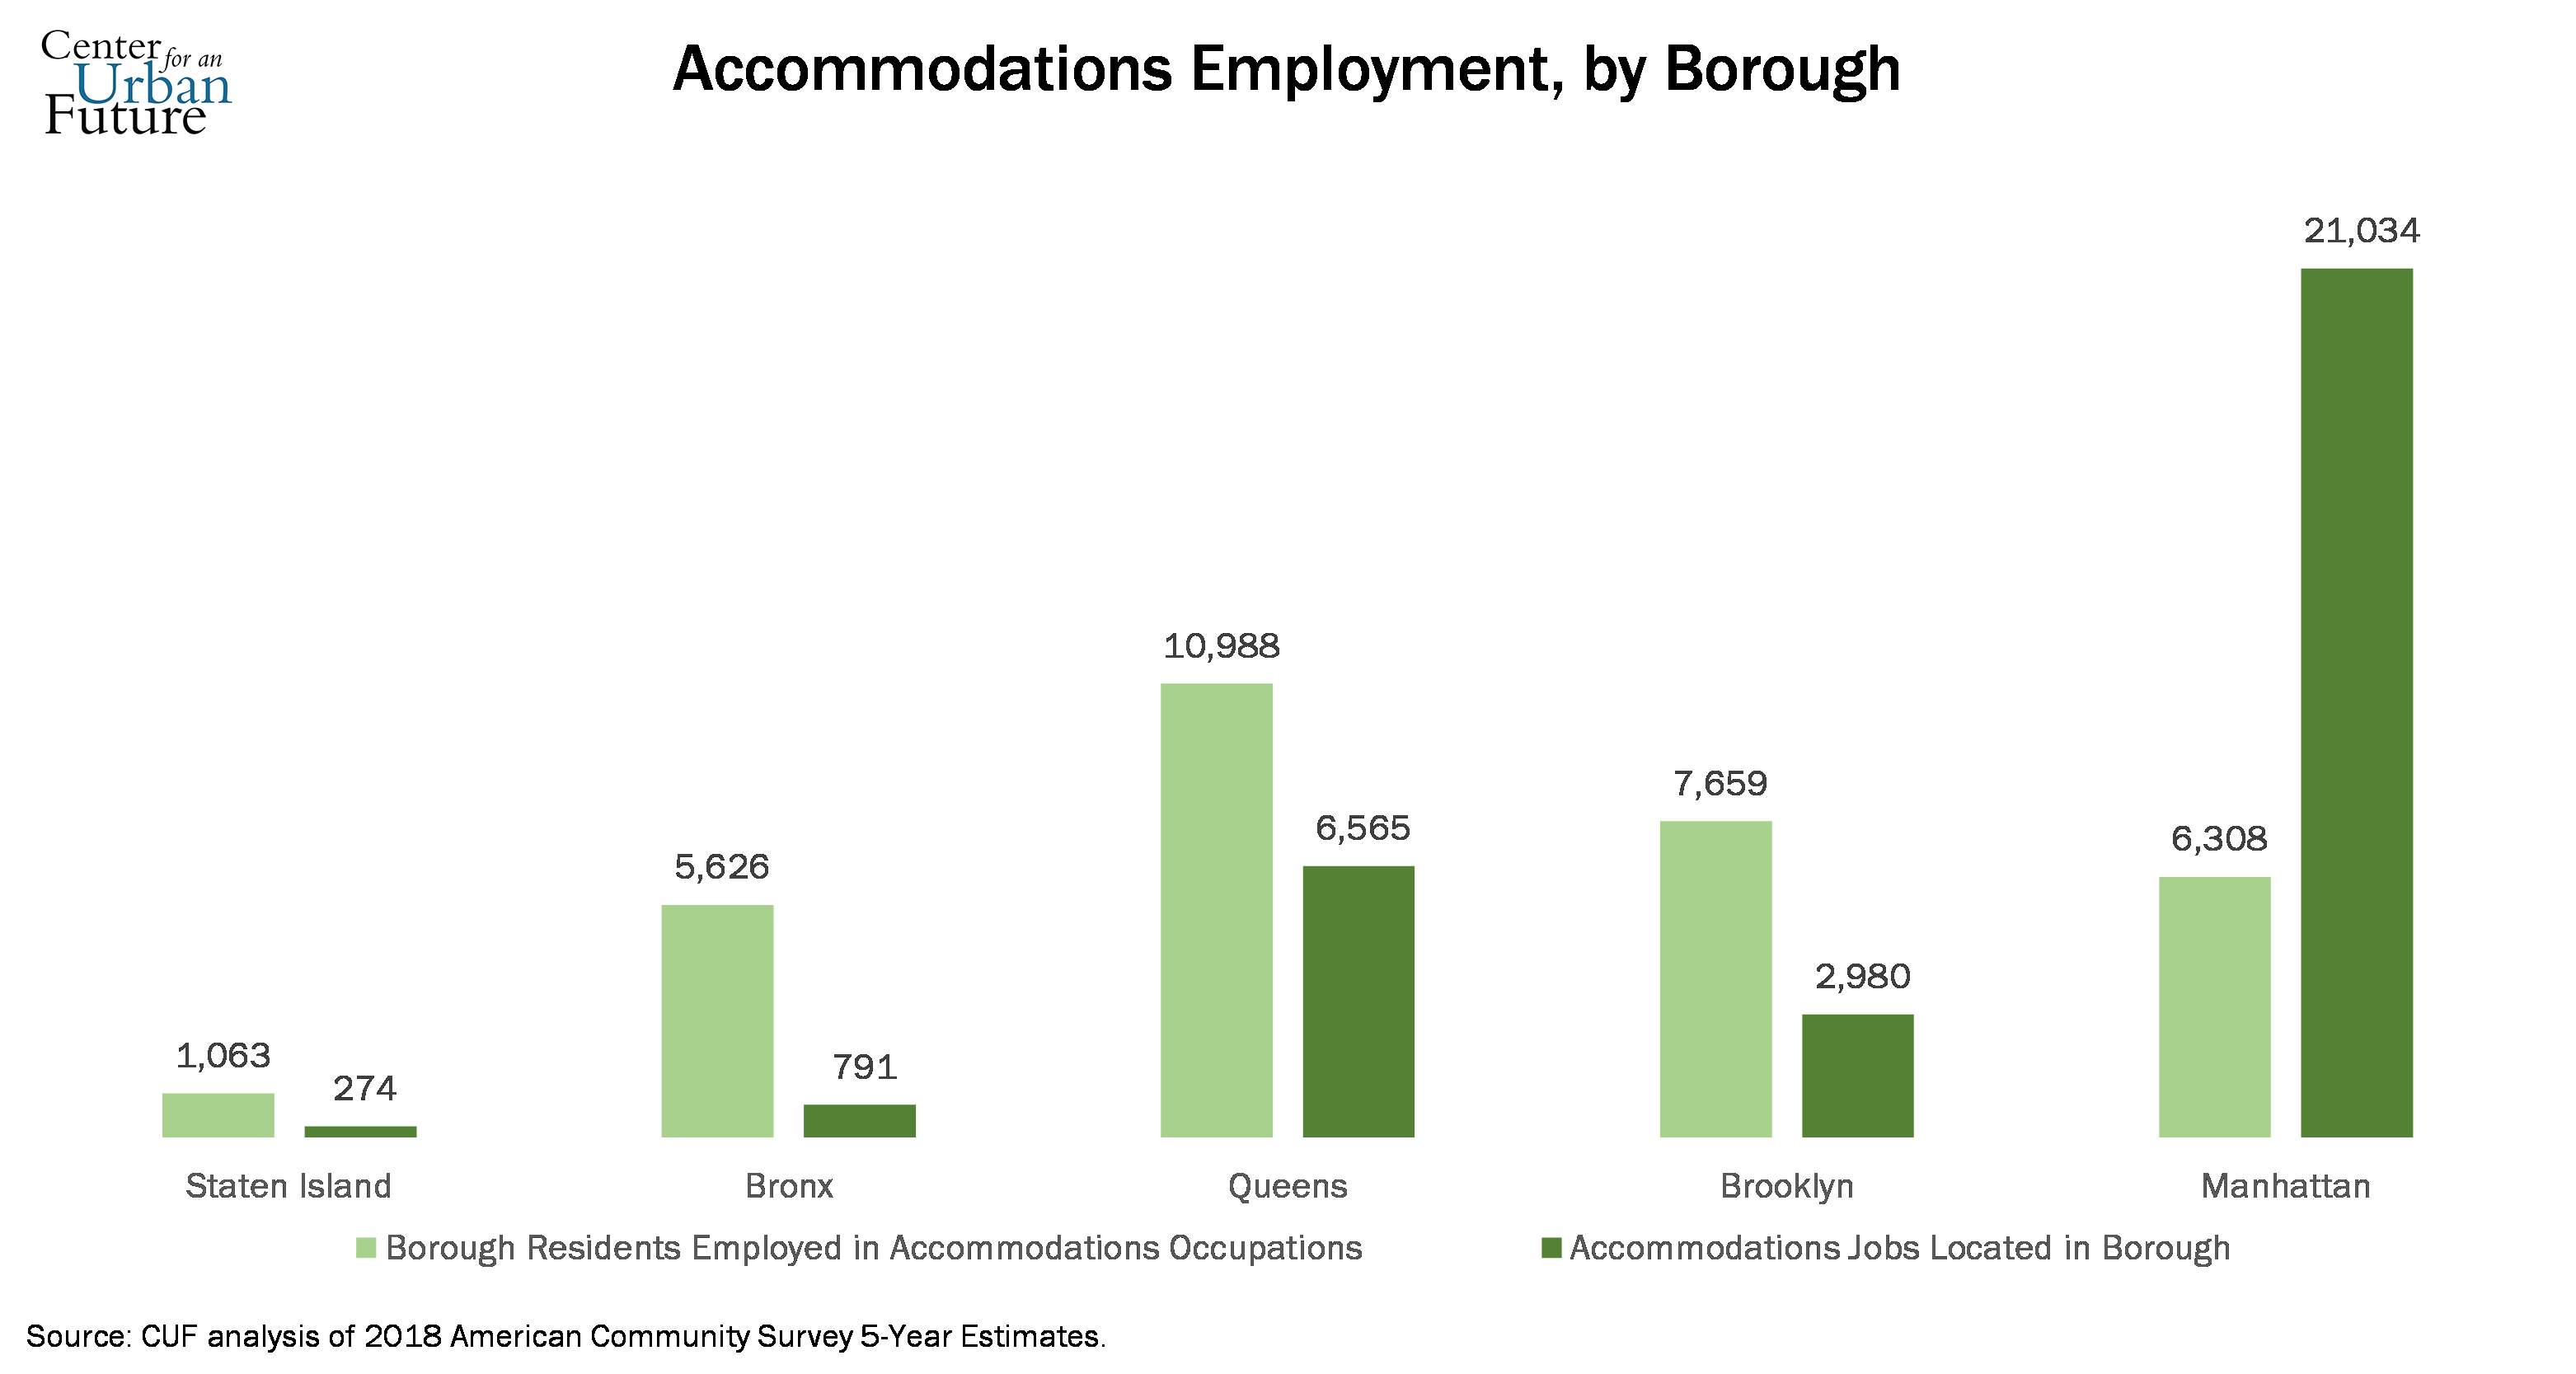
Where NYC hotel workers live
No other neighborhood in the city is home to more hotel workers than Jamaica. It has 1,231 residents working in the accommodations sector, nearly five times as many as Greenwich Village (261).
Richmond Hill (1.6 percent) and Co-op City (1.5 percent) have the highest share of residents working in the accommodations industry.
Two thirds (67 percent) of the city’s hotel jobs are located in Manhattan, but 80 percent of the New Yorkers working in those jobs live in the other four boroughs. For example while just 9 percent of the city’s accommodations jobs are physically located in Brooklyn, nearly a quarter (24 percent) of all hotel workers live in the borough.
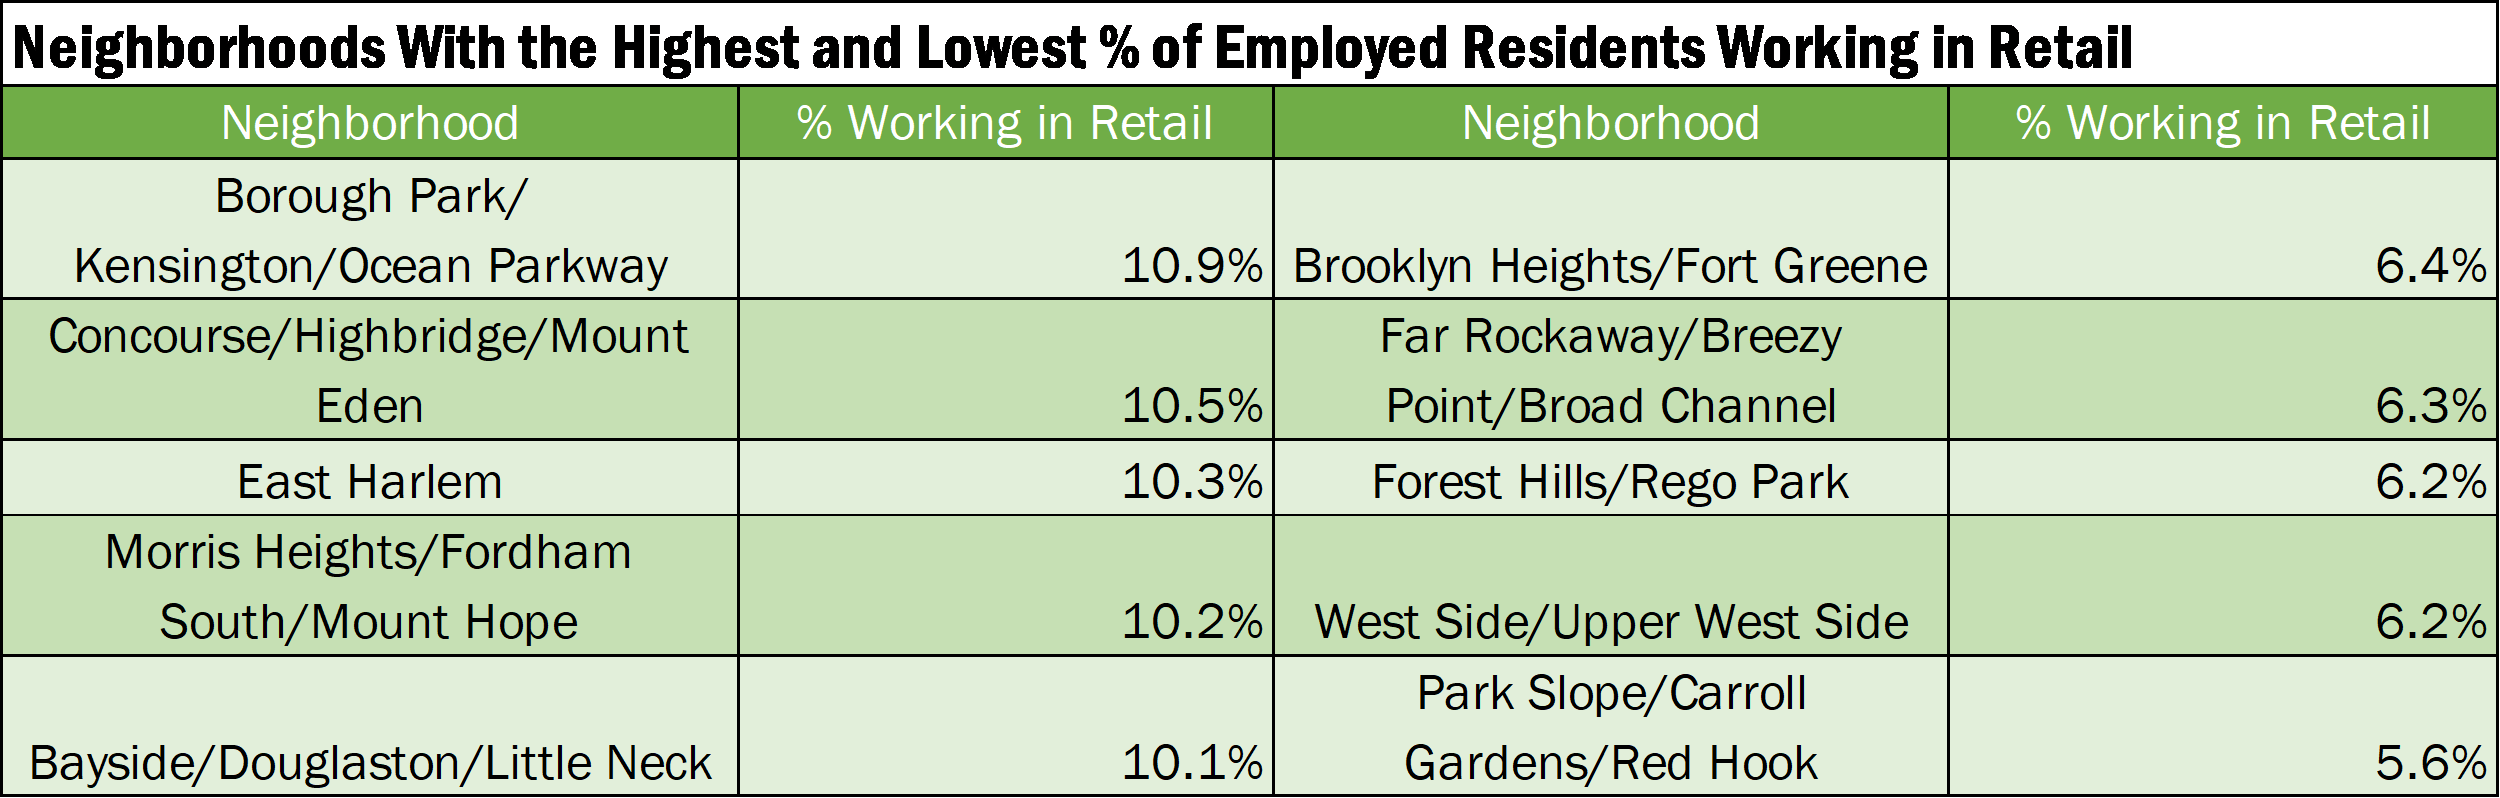
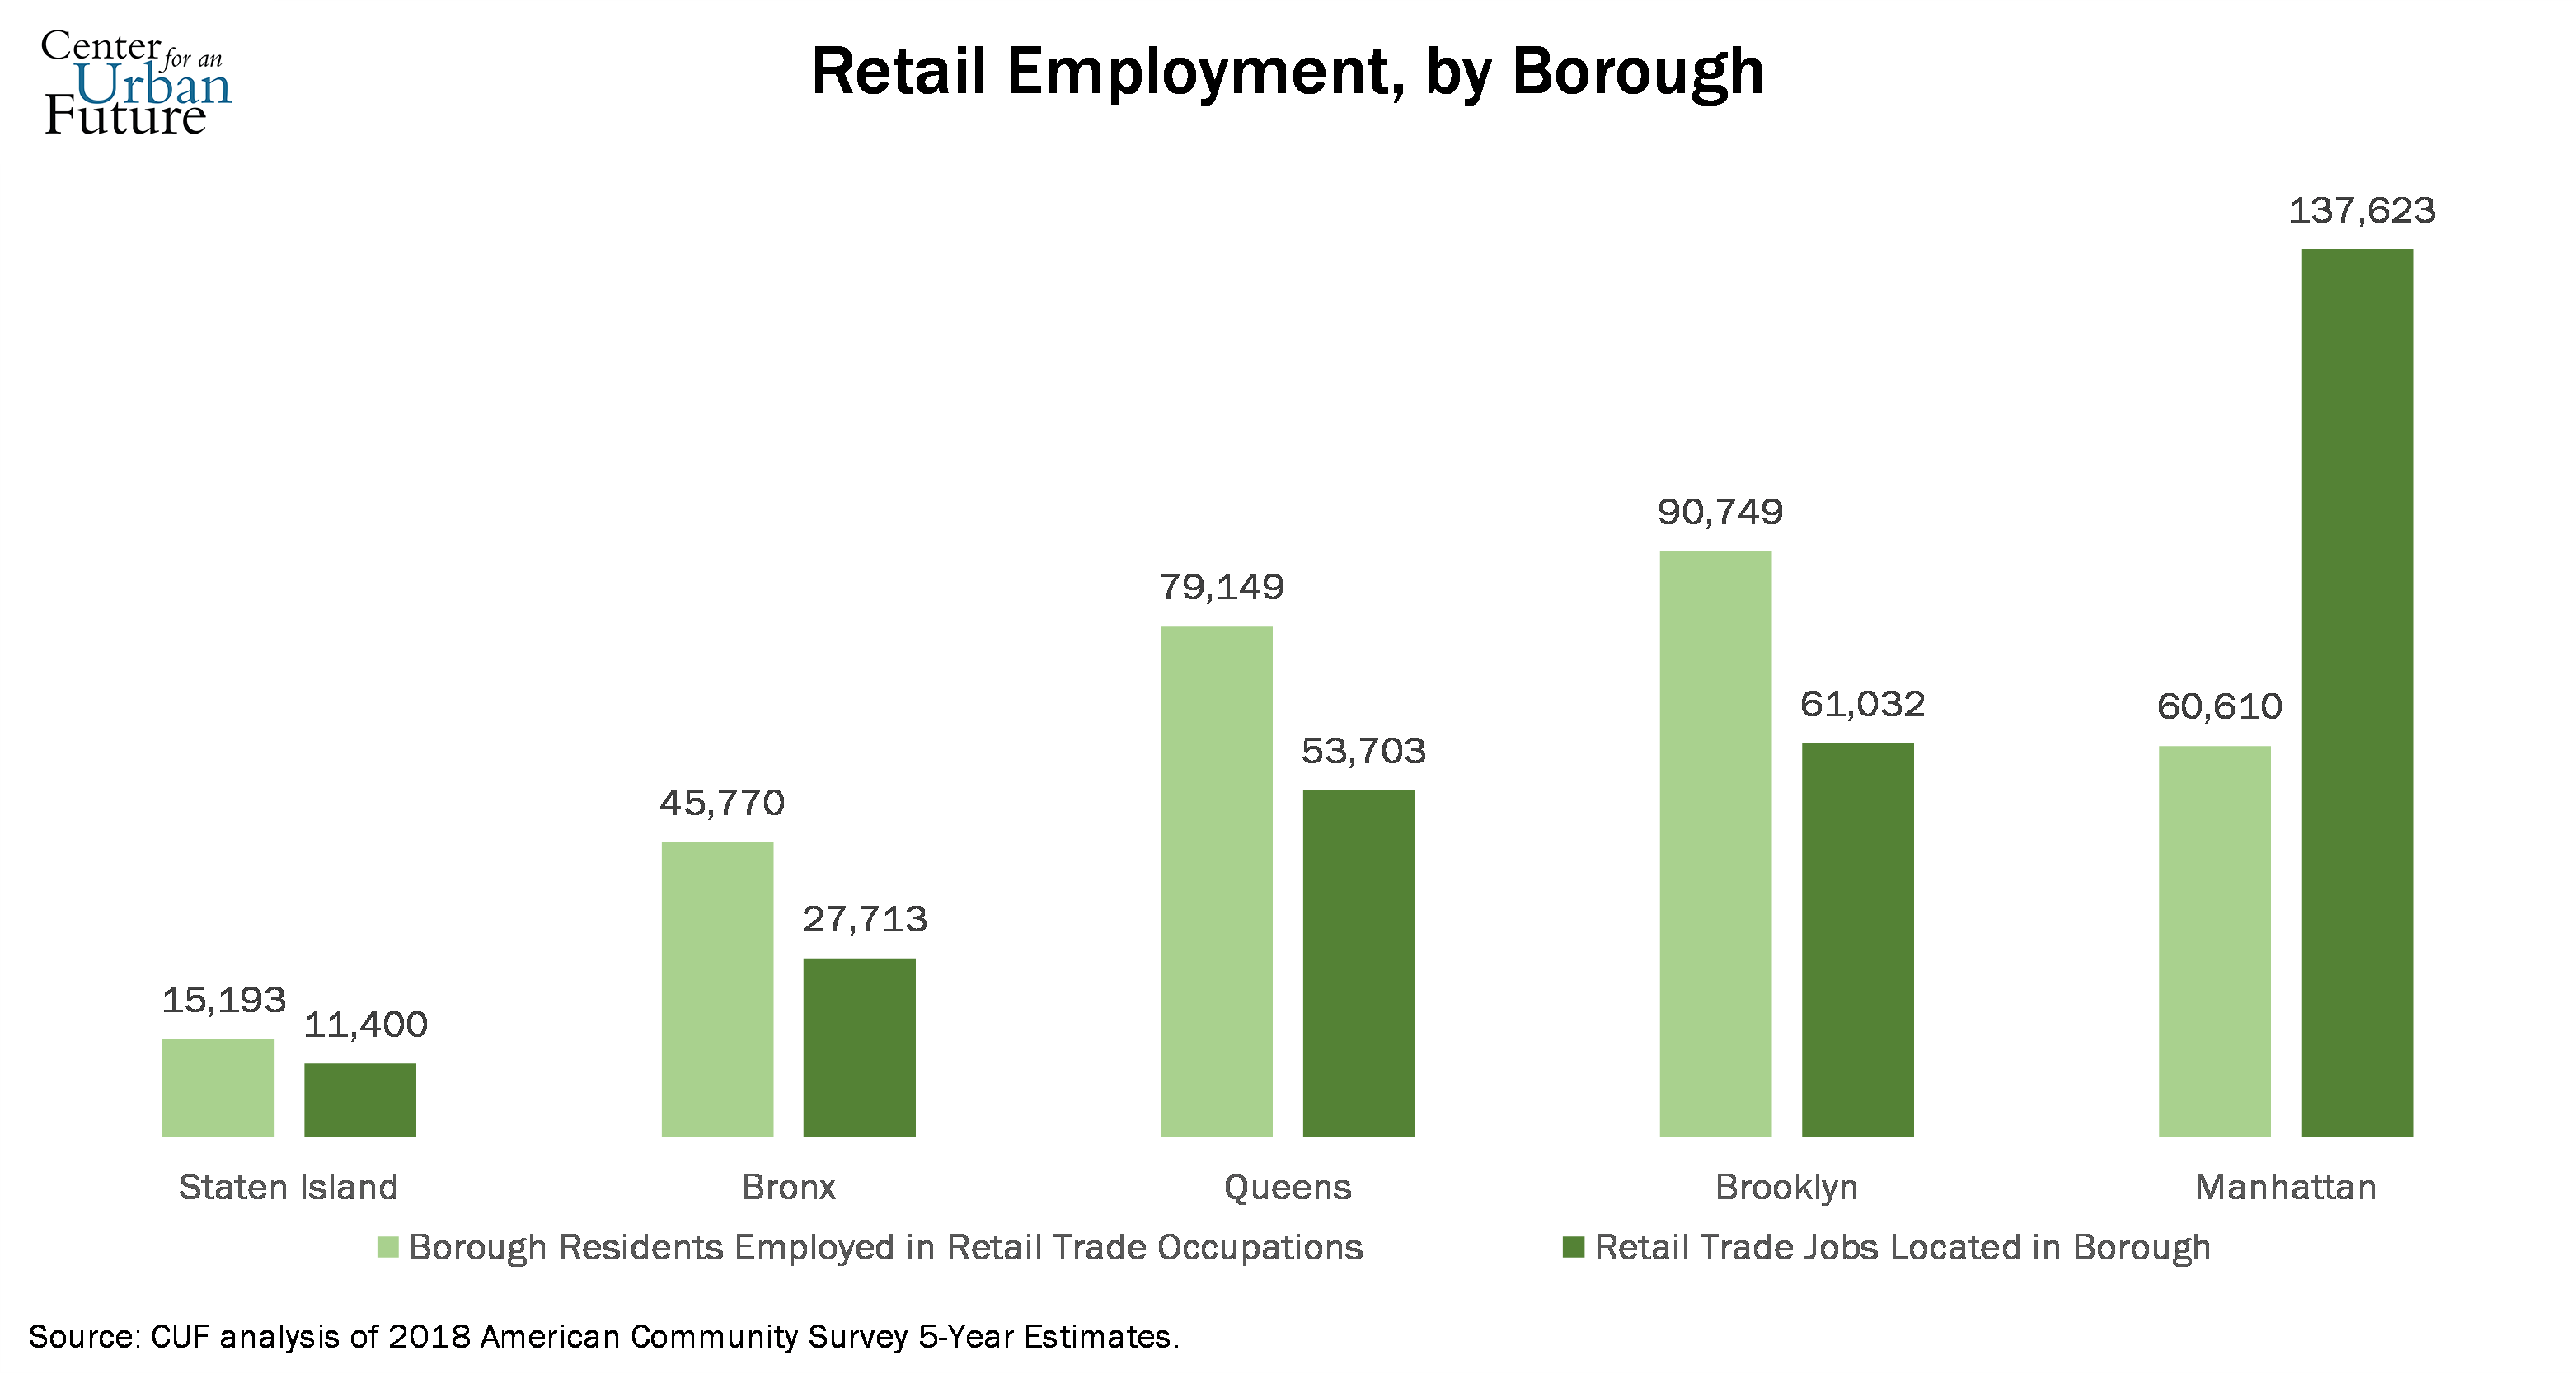
Where NYC retail workers live
Kensington and Highbridge have the largest share of residents working in the retail sector (in both neighborhoods, 11 percent of the workforce are employed in retail), followed by East Harlem, Morris Heights, Bayside, Norwood, and Flushing (all at 10 percent).
In raw numbers, Flushing has the most residents employed in the retail sector (9,493).
79 percent of the New Yorkers working in retail live in Brooklyn, the Bronx, Queens or Staten Island, even though nearly half (47 percent) of retail jobs are located in Manhattan.
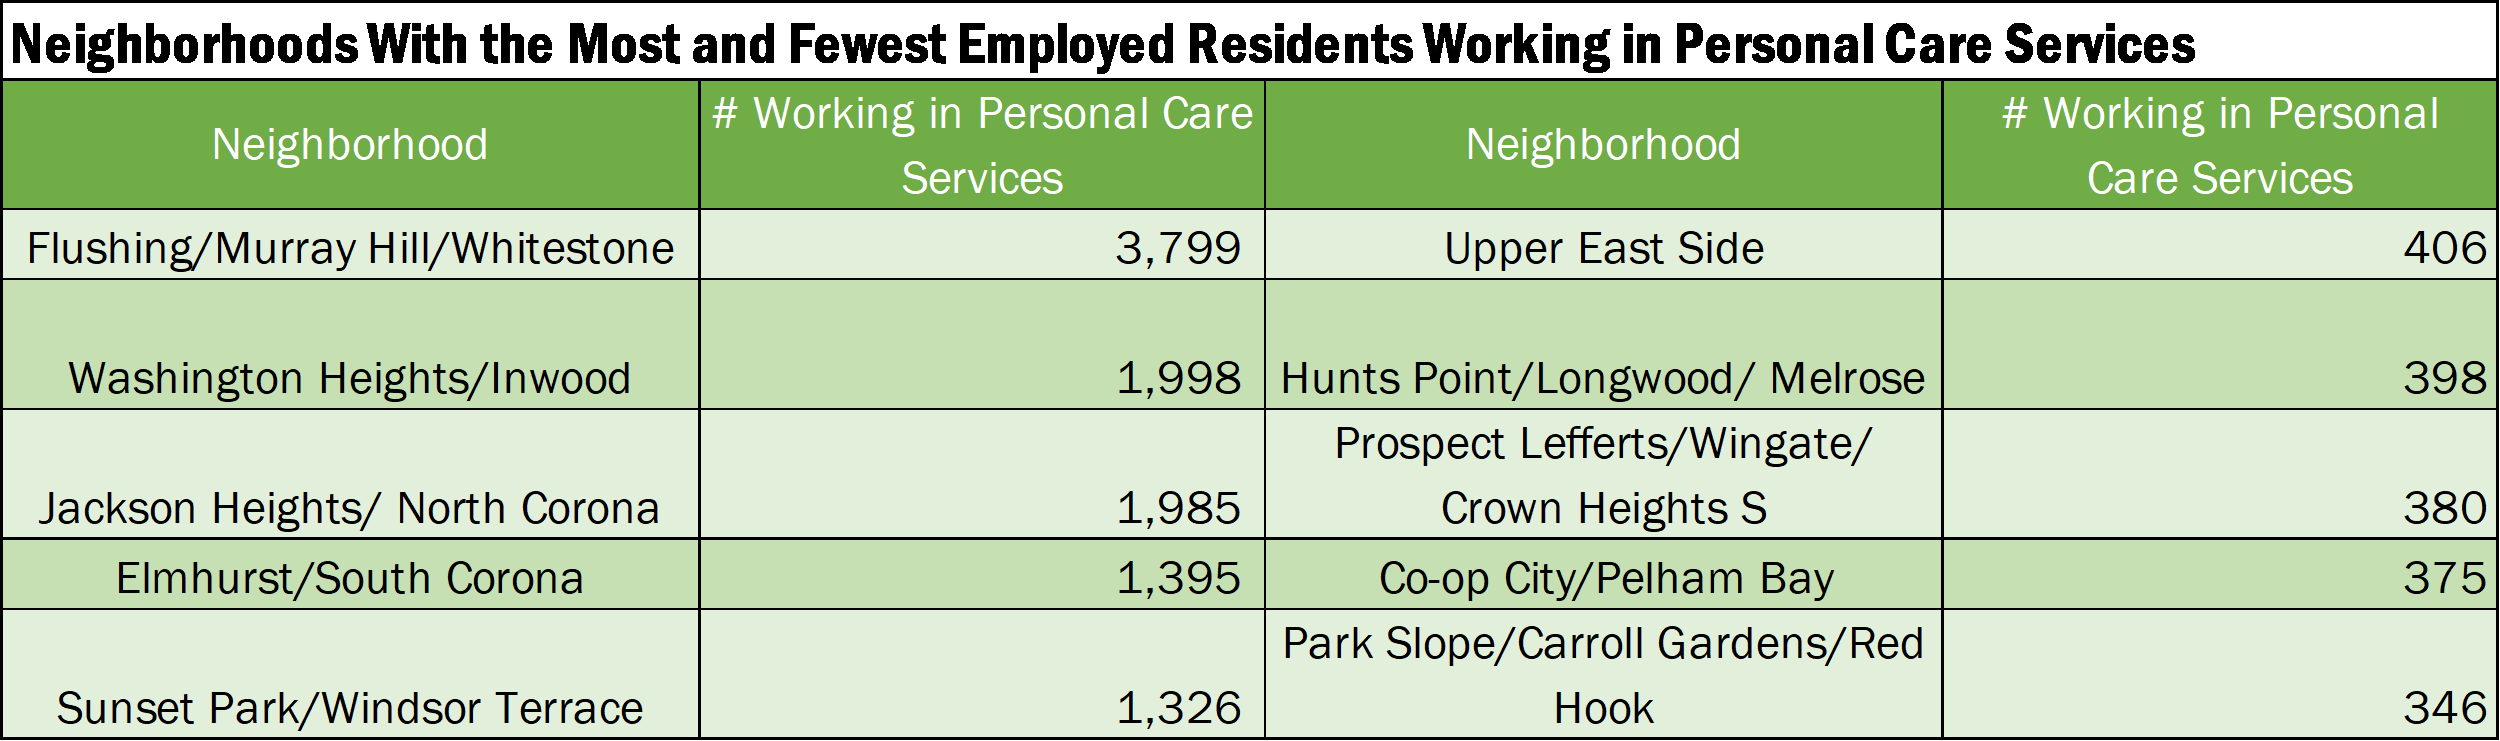
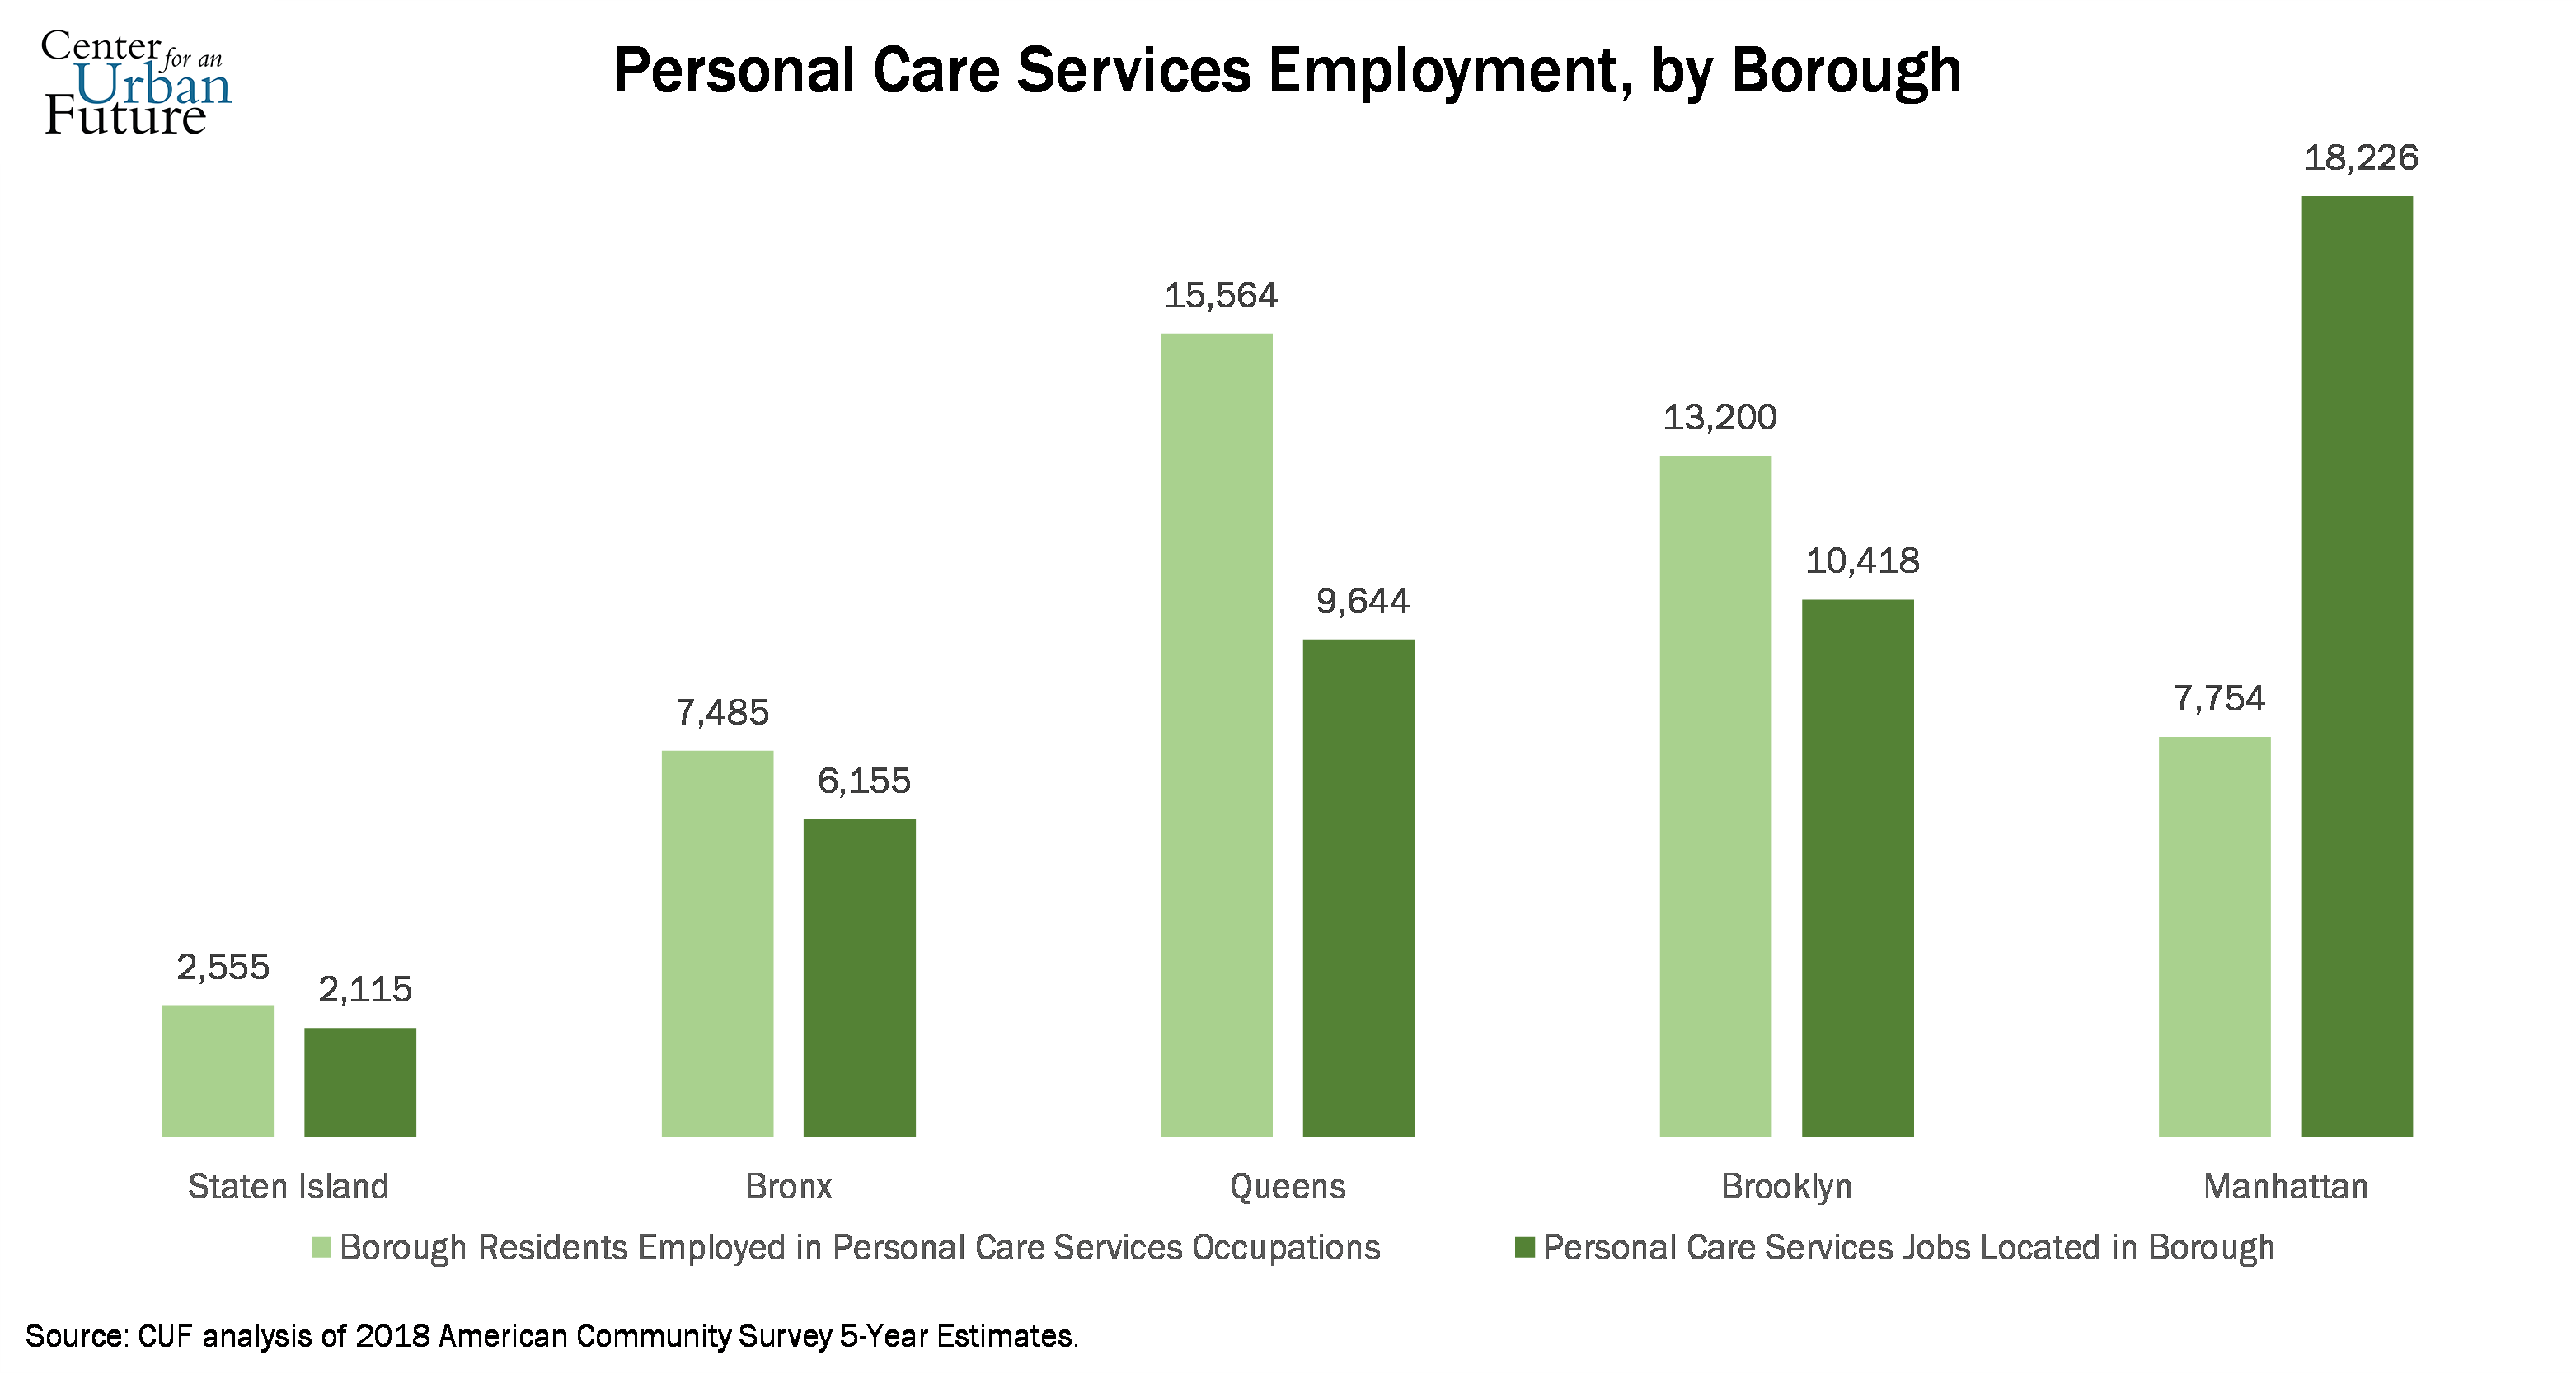
Where NYC nail salon, beauty salon and other personal care workers live
Flushing has by far the most residents working in the personal care services sector. Nearly twice as many personal care workers (3,799) live in Flushing than in the neighborhood with the second highest total (Washington Heights – with 1,998).
In contrast, just 346 residents of Park Slope work in the industry.
Flushing also has the highest share of residents working in personal care services (3.9 percent). Other neighborhoods with the greatest share of residents employed in the sector include Corona (2.5 percent), Elmhurst (2.2 percent), and Sunset Park (2.1 percent).
In each of the six neighborhoods with the highest share of residents working in personal care services, at least 45 percent of the population is foreign born.
Manhattan is home to 39 percent of the city’s personal care services jobs. However, just 17 percent of the workers in the sector live in Manhattan.
Residents Working in Restaurants/Food Service, Retail, Accommodations & Personal Care Services, by Neighborhood
Neighborhood
Number of Residents Employed in Hard-Hit Occupations
% of Employed Residents Working in Hard-Hit Occupations
Number of Employed Residents
% Non-White
% Foreign-Born
Median Household Income
% Bachelor's degree, or Higher
Elmhurst/South Corona
16795
26.9%
62463
93.9%
64.1%
$49,078
25.5%
Jackson Heights/North Corona
19442
24.6%
79042
89.6%
61.0%
$55,852
22.8%
Bedford Park/Fordham North/Norwood
12325
24.2%
50942
94.2%
46.6%
$35,535
17.8%
Concourse/Highbridge/Mount Eden
12275
23.9%
51341
98.1%
45.6%
$29,938
19.1%
Sunset Park/Windsor Terrace
15111
23.9%
63248
75.6%
48.4%
$55,317
36.5%
Flushing/Murray Hill/Whitestone
23076
23.7%
97267
74.6%
57.3%
$54,386
31.1%
Morris Heights/Fordham South/Mount Hope
10747
22.3%
48231
98.9%
44.9%
$26,976
14.3%
Hunts Point/Longwood/Melrose
10667
21.9%
48810
97.9%
30.8%
$24,849
16.5%
Sunnyside/Woodside
14867
21.0%
70714
71.1%
55.5%
$66,705
44.3%
East Harlem
10140
21.0%
48371
86.3%
25.1%
$33,564
42.9%
Bushwick
13008
20.7%
62883
81.1%
32.3%
$47,569
40.6%
Washington Heights/Inwood
20331
20.5%
98999
81.2%
48.9%
$52,051
40.3%
Castle Hill/Clason Point/Parkchester
13722
19.8%
69244
97.1%
35.3%
$40,114
21.4%
Bay Ridge/Dyker Heights
10717
19.2%
55959
45.4%
40.6%
$67,986
49.8%
Hamilton Heights/Manhattanville/West Harlem
11187
18.9%
59161
72.5%
36.6%
$50,867
53.2%
Astoria/Long Island City
15886
18.5%
85770
51.8%
41.2%
$63,592
57.4%
Belmont/Crotona Park East/East Tremont
10040
18.4%
54675
96.0%
32.8%
$25,595
17.3%
Richmond Hill/Woodhaven
11799
18.3%
64591
82.3%
52.9%
$67,914
30.7%
Borough Park/Kensington/Ocean Parkway
9936
18.3%
54414
28.9%
31.4%
$47,294
33.9%
Briarwood/Fresh Meadows/Hillcrest
11928
18.0%
66125
69.9%
47.1%
$65,679
43.3%
Pelham Parkway/Morris Park
9078
18.0%
50561
78.0%
37.5%
$50,877
28.9%
East New York/Starrett City
10666
17.5%
60799
96.2%
37.1%
$37,999
18.7%
Bensonhurst/Bath Beach
14157
17.5%
80984
59.9%
57.2%
$53,198
35.7%
Bayside/Douglaston/Little Neck
8151
17.3%
47244
60.7%
44.6%
$82,805
48.9%
Lower East Side/Chinatown
11734
17.1%
68605
66.6%
35.6%
$43,705
60.5%
Sheepshead Bay/Gerritsen Beach/Homecrest
10416
16.6%
62787
34.5%
51.8%
$60,814
46.7%
Co-op City/Pelham Bay
7545
16.4%
45956
72.5%
22.0%
$59,798
32.7%
Riverdale/Kingsbridge
7003
16.2%
43159
67.6%
34.6%
$59,995
44.6%
Port Richmond/Stapleton/Mariner's Harbor
11056
16.0%
69060
62.2%
26.1%
$64,666
35.7%
Ridgewood/Glendale/Middle Village
13645
15.9%
85867
48.2%
40.6%
$73,644
33.2%
Brownsville/Ocean Hill
6458
15.7%
41181
97.4%
31.6%
$28,862
21.5%
Woodlawn/Williamsbridge/Wakefield
8109
15.7%
51807
93.6%
43.0%
$51,581
30.1%
Howard Beach/Ozone Park
8763
15.6%
56009
78.1%
46.5%
$72,400
27.8%
Bedford-Stuyvesant
9999
15.6%
64185
74.0%
20.2%
$47,706
43.9%
Brighton Beach/Coney Island
6369
15.4%
41264
44.1%
54.0%
$38,065
42.5%
Jamaica/Hollis/St. Albans
14408
15.2%
94580
98.2%
43.1%
$62,228
24.4%
Central Harlem
8931
14.7%
60702
85.8%
23.9%
$47,341
49.0%
Williamsburg/Greenpoint
11800
14.5%
81292
37.0%
25.1%
$71,248
62.0%
Flatbush/Midwood
9791
14.2%
69159
59.3%
43.1%
$55,569
41.4%
Prospect Lefferts/Wingate/Crown Heights S
7097
14.0%
50836
77.2%
43.1%
$50,765
39.5%
New Springville/South Beach
7266
13.2%
55102
33.9%
30.1%
$81,479
40.1%
East Flatbush/Farragut/Rugby
7971
13.0%
61104
97.3%
52.3%
$52,291
29.2%
Forest Hills/Rego Park
6823
13.0%
52445
52.3%
52.0%
$74,618
63.6%
Prospect Heights/Crown Heights North
8264
12.9%
64085
77.7%
29.2%
$52,917
50.7%
Tottenville/Great Kills/Annadale
8561
12.7%
67296
17.2%
17.1%
$91,431
42.1%
Midtown/Chelsea
12069
12.6%
95899
40.5%
31.3%
$104,801
81.2%
Far Rockaway/Breezy Point/Broad Channel
5104
12.3%
41623
65.7%
27.8%
$53,968
37.1%
Canarsie/Flatlands
11090
12.1%
91611
77.3%
42.8%
$74,840
37.4%
Queens Village/Cambria Heights/Rosedale
9326
12.1%
77144
89.1%
44.0%
$85,266
33.6%
Brooklyn Heights/Fort Greene
7988
10.9%
73489
53.6%
20.6%
$93,434
72.4%
Soho/Battery Park City/Greenwich Village
9773
10.7%
91456
27.7%
25.4%
$140,213
87.4%
Midtown East/Murray Hill/Gramercy/Stuyvescant Town
9352
10.6%
88275
30.4%
24.5%
$117,921
88.2%
Park Slope/Carroll Gardens/Red Hook
6263
9.8%
64161
35.7%
18.5%
$122,002
81.7%
Upper East Side
11143
9.4%
118648
24.7%
24.0%
$120,868
87.8%
West Side/Upper West Side
9298
9.4%
99276
31.8%
24.2%
$117,421
82.6%
Residents Working in Restaurants/Food Service, by Neighborhood
Neighborhood
Number of Residents Employed in Food Services Jobs
% of Employed Residents Working in Food Services Jobs
Number of Employed Residents
% Non-White
% Foreign-Born
Median Household Income
%, Bachelor's degree or Higher
Elmhurst/South Corona
9674
15.5%
62463
93.9%
64.1%
$49,078
25.5%
Jackson Heights/North Corona
10593
13.4%
79042
89.6%
61.0%
$55,852
22.8%
Sunset Park/Windsor Terrace
7845
12.4%
63248
75.6%
48.4%
$55,317
36.5%
Hunts Point/Longwood/Melrose
5521
11.3%
48810
97.9%
30.8%
$24,849
16.5%
Bedford Park/Fordham North/Norwood
5599
11.0%
50942
94.2%
46.6%
$35,535
17.8%
Concourse/Highbridge/Mount Eden
5620
10.9%
51341
98.1%
45.6%
$29,938
19.1%
Sunnyside/Woodside
7451
10.5%
70714
71.1%
55.5%
$66,705
44.3%
Washington Heights/Inwood
9953
10.1%
98999
81.2%
48.9%
$52,051
40.3%
Bushwick
6195
9.9%
62883
81.1%
32.3%
$47,569
40.6%
Morris Heights/Fordham South/Mount Hope
4594
9.5%
48231
98.9%
44.9%
$26,976
14.3%
Hamilton Heights/Manhattanville/West Harlem
5579
9.4%
59161
72.5%
36.6%
$50,867
53.2%
Flushing/Murray Hill/Whitestone
8684
8.9%
97267
74.6%
57.3%
$54,386
31.1%
East Harlem
4301
8.9%
48371
86.3%
25.1%
$33,564
42.9%
Astoria/Long Island City
7343
8.6%
85770
51.8%
41.2%
$63,592
57.4%
Castle Hill/Clason Point/Parkchester
5652
8.2%
69244
97.1%
35.3%
$40,114
21.4%
Bay Ridge/Dyker Heights
4497
8.0%
55959
45.4%
40.6%
$67,986
49.8%
Richmond Hill/Woodhaven
4737
7.3%
64591
82.3%
52.9%
$67,914
30.7%
Lower East Side/Chinatown
4963
7.2%
68605
66.6%
35.6%
$43,705
60.5%
Bensonhurst/Bath Beach
5690
7.0%
80984
59.9%
57.2%
$53,198
35.7%
Belmont/Crotona Park East/East Tremont
3754
6.9%
54675
96.0%
32.8%
$25,595
17.3%
Riverdale/Kingsbridge
2935
6.8%
43159
67.6%
34.6%
$59,995
44.6%
Pelham Parkway/Morris Park
3327
6.6%
50561
78.0%
37.5%
$50,877
28.9%
Briarwood/Fresh Meadows/Hillcrest
4335
6.6%
66125
69.9%
47.1%
$65,679
43.3%
Ridgewood/Glendale/Middle Village
5578
6.5%
85867
48.2%
40.6%
$73,644
33.2%
Co-op City/Pelham Bay
2782
6.1%
45956
72.5%
22.0%
$59,798
32.7%
Bedford-Stuyvesant
3865
6.0%
64185
74.0%
20.2%
$47,706
43.9%
Central Harlem
3627
6.0%
60702
85.8%
23.9%
$47,341
49.0%
Borough Park/Kensington/Ocean Parkway
3101
5.7%
54414
28.9%
31.4%
$47,294
33.9%
East New York/Starrett City
3381
5.6%
60799
96.2%
37.1%
$37,999
18.7%
Woodlawn/Williamsbridge/Wakefield
2846
5.5%
51807
93.6%
43.0%
$51,581
30.1%
Brownsville/Ocean Hill
2222
5.4%
41181
97.4%
31.6%
$28,862
21.5%
Brighton Beach/Coney Island
2168
5.3%
41264
44.1%
54.0%
$38,065
42.5%
Port Richmond/Stapleton/Mariner's Harbor
3595
5.2%
69060
62.2%
26.1%
$64,666
35.7%
Williamsburg/Greenpoint
4196
5.2%
81292
37.0%
25.1%
$71,248
62.0%
Prospect Lefferts/Wingate/Crown Heights S
2614
5.1%
50836
77.2%
43.1%
$50,765
39.5%
Jamaica/Hollis/St. Albans
4862
5.1%
94580
98.2%
43.1%
$62,228
24.4%
Sheepshead Bay/Gerritsen Beach/Homecrest
3121
5.0%
62787
34.5%
51.8%
$60,814
46.7%
Howard Beach/Ozone Park
2709
4.8%
56009
78.1%
46.5%
$72,400
27.8%
Flatbush/Midwood
3318
4.8%
69159
59.3%
43.1%
$55,569
41.4%
Bayside/Douglaston/Little Neck
2234
4.7%
47244
60.7%
44.6%
$82,805
48.9%
Prospect Heights/Crown Heights North
2862
4.5%
64085
77.7%
29.2%
$52,917
50.7%
New Springville/South Beach
2448
4.4%
55102
33.9%
30.1%
$81,479
40.1%
East Flatbush/Farragut/Rugby
2704
4.4%
61104
97.3%
52.3%
$52,291
29.2%
Far Rockaway/Breezy Point/Broad Channel
1645
4.0%
41623
65.7%
27.8%
$53,968
37.1%
Midtown/Chelsea
3407
3.6%
95899
40.5%
31.3%
$104,801
81.2%
Canarsie/Flatlands
3248
3.5%
91611
77.3%
42.8%
$74,840
37.4%
Forest Hills/Rego Park
1839
3.5%
52445
52.3%
52.0%
$74,618
63.6%
Queens Village/Cambria Heights/Rosedale
2628
3.4%
77144
89.1%
44.0%
$85,266
33.6%
Brooklyn Heights/Fort Greene
2407
3.3%
73489
53.6%
20.6%
$93,434
72.4%
Park Slope/Carroll Gardens/Red Hook
2059
3.2%
64161
35.7%
18.5%
$122,002
81.7%
Tottenville/Great Kills/Annadale
2029
3.0%
67296
17.2%
17.1%
$91,431
42.1%
Midtown East/Murray Hill/Gramercy/Stuyvescant Town
2110
2.4%
88275
30.4%
24.5%
$117,921
88.2%
West Side/Upper West Side
2071
2.1%
99276
31.8%
24.2%
$117,421
82.6%
Soho/Battery Park City/Greenwich Village
1826
2.0%
91456
27.7%
25.4%
$140,213
87.4%
Upper East Side
1449
1.2%
118648
24.7%
24.0%
$120,868
87.8%
Residents Working in Retail, by Neighborhood
Neighborhood
Number of Residents Employed in Retail Jobs
% of Employed Residents Working in Retail Trade Jobs
Number of Employed Residents
% Non-White
% Foreign-Born
Median Household Income
%, Bachelor's degree or Higher
Borough Park/Kensington/Ocean Parkway
5914
10.9%
54414
28.9%
31.4%
$47,294
33.9%
Concourse/Highbridge/Mount Eden
5367
10.5%
51341
98.1%
45.6%
$29,938
19.1%
East Harlem
4962
10.3%
48371
86.3%
25.1%
$33,564
42.9%
Morris Heights/Fordham South/Mount Hope
4925
10.2%
48231
98.9%
44.9%
$26,976
14.3%
Bayside/Douglaston/Little Neck
4787
10.1%
47244
60.7%
44.6%
$82,805
48.9%
Bedford Park/Fordham North/Norwood
5111
10.0%
50942
94.2%
46.6%
$35,535
17.8%
Flushing/Murray Hill/Whitestone
9493
9.8%
97267
74.6%
57.3%
$54,386
31.1%
Briarwood/Fresh Meadows/Hillcrest
6355
9.6%
66125
69.9%
47.1%
$65,679
43.3%
East New York/Starrett City
5779
9.5%
60799
96.2%
37.1%
$37,999
18.7%
Castle Hill/Clason Point/Parkchester
6421
9.3%
69244
97.1%
35.3%
$40,114
21.4%
Sheepshead Bay/Gerritsen Beach/Homecrest
5801
9.2%
62787
34.5%
51.8%
$60,814
46.7%
Bushwick
5799
9.2%
62883
81.1%
32.3%
$47,569
40.6%
Port Richmond/Stapleton/Mariner's Harbor
6236
9.0%
69060
62.2%
26.1%
$64,666
35.7%
Howard Beach/Ozone Park
5019
9.0%
56009
78.1%
46.5%
$72,400
27.8%
Pelham Parkway/Morris Park
4486
8.9%
50561
78.0%
37.5%
$50,877
28.9%
Belmont/Crotona Park East/East Tremont
4771
8.7%
54675
96.0%
32.8%
$25,595
17.3%
Brighton Beach/Coney Island
3567
8.6%
41264
44.1%
54.0%
$38,065
42.5%
Bay Ridge/Dyker Heights
4828
8.6%
55959
45.4%
40.6%
$67,986
49.8%
Hunts Point/Longwood/Melrose
4210
8.6%
48810
97.9%
30.8%
$24,849
16.5%
Sunset Park/Windsor Terrace
5443
8.6%
63248
75.6%
48.4%
$55,317
36.5%
Elmhurst/South Corona
5213
8.3%
62463
93.9%
64.1%
$49,078
25.5%
Richmond Hill/Woodhaven
5308
8.2%
64591
82.3%
52.9%
$67,914
30.7%
Bensonhurst/Bath Beach
6586
8.1%
80984
59.9%
57.2%
$53,198
35.7%
Bedford-Stuyvesant
5216
8.1%
64185
74.0%
20.2%
$47,706
43.9%
Co-op City/Pelham Bay
3697
8.0%
45956
72.5%
22.0%
$59,798
32.7%
Brownsville/Ocean Hill
3255
7.9%
41181
97.4%
31.6%
$28,862
21.5%
Jamaica/Hollis/St. Albans
7465
7.9%
94580
98.2%
43.1%
$62,228
24.4%
Astoria/Long Island City
6764
7.9%
85770
51.8%
41.2%
$63,592
57.4%
Williamsburg/Greenpoint
6410
7.9%
81292
37.0%
25.1%
$71,248
62.0%
Tottenville/Great Kills/Annadale
5262
7.8%
67296
17.2%
17.1%
$91,431
42.1%
Jackson Heights/North Corona
6135
7.8%
79042
89.6%
61.0%
$55,852
22.8%
Sunnyside/Woodside
5482
7.8%
70714
71.1%
55.5%
$66,705
44.3%
Lower East Side/Chinatown
5314
7.7%
68605
66.6%
35.6%
$43,705
60.5%
Flatbush/Midwood
5291
7.7%
69159
59.3%
43.1%
$55,569
41.4%
Soho/Battery Park City/Greenwich Village
6960
7.6%
91456
27.7%
25.4%
$140,213
87.4%
Woodlawn/Williamsbridge/Wakefield
3901
7.5%
51807
93.6%
43.0%
$51,581
30.1%
Washington Heights/Inwood
7417
7.5%
98999
81.2%
48.9%
$52,051
40.3%
Midtown/Chelsea
7024
7.3%
95899
40.5%
31.3%
$104,801
81.2%
Upper East Side
8542
7.2%
118648
24.7%
24.0%
$120,868
87.8%
Prospect Lefferts/Wingate/Crown Heights S
3639
7.2%
50836
77.2%
43.1%
$50,765
39.5%
Central Harlem
4344
7.2%
60702
85.8%
23.9%
$47,341
49.0%
Canarsie/Flatlands
6455
7.0%
91611
77.3%
42.8%
$74,840
37.4%
East Flatbush/Farragut/Rugby
4295
7.0%
61104
97.3%
52.3%
$52,291
29.2%
Hamilton Heights/Manhattanville/West Harlem
4150
7.0%
59161
72.5%
36.6%
$50,867
53.2%
Ridgewood/Glendale/Middle Village
5963
6.9%
85867
48.2%
40.6%
$73,644
33.2%
Queens Village/Cambria Heights/Rosedale
5279
6.8%
77144
89.1%
44.0%
$85,266
33.6%
New Springville/South Beach
3695
6.7%
55102
33.9%
30.1%
$81,479
40.1%
Riverdale/Kingsbridge
2881
6.7%
43159
67.6%
34.6%
$59,995
44.6%
Prospect Heights/Crown Heights North
4178
6.5%
64085
77.7%
29.2%
$52,917
50.7%
Midtown East/Murray Hill/Gramercy/Stuyvescant Town
5722
6.5%
88275
30.4%
24.5%
$117,921
88.2%
Brooklyn Heights/Fort Greene
4716
6.4%
73489
53.6%
20.6%
$93,434
72.4%
Far Rockaway/Breezy Point/Broad Channel
2611
6.3%
41623
65.7%
27.8%
$53,968
37.1%
Forest Hills/Rego Park
3275
6.2%
52445
52.3%
52.0%
$74,618
63.6%
West Side/Upper West Side
6175
6.2%
99276
31.8%
24.2%
$117,421
82.6%
Park Slope/Carroll Gardens/Red Hook
3577
5.6%
64161
35.7%
18.5%
$122,002
81.7%
Residents Working in Accommodations, by Neighborhood
Neighborhood
Number of Residents Employed in Accommodations Jobs
% of Employed Residents Working in Accommodations Jobs
Number of Employed Residents
% Non-White
% Foreign-Born
Median Household Income
%, Bachelor's degree or Higher
Richmond Hill/Woodhaven
1010
1.6%
64591
82.3%
52.9%
$67,914
30.7%
Co-op City/Pelham Bay
691
1.5%
45956
72.5%
22.0%
$59,798
32.7%
Riverdale/Kingsbridge
605
1.4%
43159
67.6%
34.6%
$59,995
44.6%
Pelham Parkway/Morris Park
728
1.4%
50561
78.0%
37.5%
$50,877
28.9%
Sunnyside/Woodside
1008
1.4%
70714
71.1%
55.5%
$66,705
44.3%
Queens Village/Cambria Heights/Rosedale
972
1.3%
77144
89.1%
44.0%
$85,266
33.6%
Forest Hills/Rego Park
688
1.3%
52445
52.3%
52.0%
$74,618
63.6%
Jamaica/Hollis/St. Albans
1231
1.3%
94580
98.2%
43.1%
$62,228
24.4%
Castle Hill/Clason Point/Parkchester
819
1.2%
69244
97.1%
35.3%
$40,114
21.4%
Hamilton Heights/Manhattanville/West Harlem
681
1.2%
59161
72.5%
36.6%
$50,867
53.2%
Midtown/Chelsea
1105
1.2%
95899
40.5%
31.3%
$104,801
81.2%
Brownsville/Ocean Hill
502
1.2%
41181
97.4%
31.6%
$28,862
21.5%
East New York/Starrett City
751
1.2%
60799
96.2%
37.1%
$37,999
18.7%
Astoria/Long Island City
1038
1.2%
85770
51.8%
41.2%
$63,592
57.4%
Bedford Park/Fordham North/Norwood
578
1.1%
50942
94.2%
46.6%
$35,535
17.8%
Hunts Point/Longwood/Melrose
538
1.1%
48810
97.9%
30.8%
$24,849
16.5%
Flushing/Murray Hill/Whitestone
1100
1.1%
97267
74.6%
57.3%
$54,386
31.1%
Ridgewood/Glendale/Middle Village
977
1.1%
85867
48.2%
40.6%
$73,644
33.2%
Belmont/Crotona Park East/East Tremont
525
1.0%
54675
96.0%
32.8%
$25,595
17.3%
Morris Heights/Fordham South/Mount Hope
478
1.0%
48231
98.9%
44.9%
$26,976
14.3%
Washington Heights/Inwood
963
1.0%
98999
81.2%
48.9%
$52,051
40.3%
Bay Ridge/Dyker Heights
585
1.0%
55959
45.4%
40.6%
$67,986
49.8%
Bayside/Douglaston/Little Neck
455
1.0%
47244
60.7%
44.6%
$82,805
48.9%
East Harlem
459
0.9%
48371
86.3%
25.1%
$33,564
42.9%
Lower East Side/Chinatown
606
0.9%
68605
66.6%
35.6%
$43,705
60.5%
Prospect Lefferts/Wingate/Crown Heights S
464
0.9%
50836
77.2%
43.1%
$50,765
39.5%
Jackson Heights/North Corona
729
0.9%
79042
89.6%
61.0%
$55,852
22.8%
Howard Beach/Ozone Park
518
0.9%
56009
78.1%
46.5%
$72,400
27.8%
Midtown East/Murray Hill/Gramercy/Stuyvescant Town
669
0.8%
88275
30.4%
24.5%
$117,921
88.2%
Canarsie/Flatlands
701
0.8%
91611
77.3%
42.8%
$74,840
37.4%
Sunset Park/Windsor Terrace
497
0.8%
63248
75.6%
48.4%
$55,317
36.5%
Bensonhurst/Bath Beach
632
0.8%
80984
59.9%
57.2%
$53,198
35.7%
Elmhurst/South Corona
513
0.8%
62463
93.9%
64.1%
$49,078
25.5%
Woodlawn/Williamsbridge/Wakefield
352
0.7%
51807
93.6%
43.0%
$51,581
30.1%
Briarwood/Fresh Meadows/Hillcrest
470
0.7%
66125
69.9%
47.1%
$65,679
43.3%
Far Rockaway/Breezy Point/Broad Channel
279
0.7%
41623
65.7%
27.8%
$53,968
37.1%
Concourse/Highbridge/Mount Eden
312
0.6%
51341
98.1%
45.6%
$29,938
19.1%
Upper East Side
746
0.6%
118648
24.7%
24.0%
$120,868
87.8%
West Side/Upper West Side
585
0.6%
99276
31.8%
24.2%
$117,421
82.6%
Tottenville/Great Kills/Annadale
384
0.6%
67296
17.2%
17.1%
$91,431
42.1%
Bushwick
362
0.6%
62883
81.1%
32.3%
$47,569
40.6%
Brooklyn Heights/Fort Greene
445
0.6%
73489
53.6%
20.6%
$93,434
72.4%
Prospect Heights/Crown Heights North
353
0.6%
64085
77.7%
29.2%
$52,917
50.7%
Borough Park/Kensington/Ocean Parkway
327
0.6%
54414
28.9%
31.4%
$47,294
33.9%
Flatbush/Midwood
426
0.6%
69159
59.3%
43.1%
$55,569
41.4%
New Springville/South Beach
300
0.5%
55102
33.9%
30.1%
$81,479
40.1%
Port Richmond/Stapleton/Mariner's Harbor
379
0.5%
69060
62.2%
26.1%
$64,666
35.7%
Brighton Beach/Coney Island
211
0.5%
41264
44.1%
54.0%
$38,065
42.5%
Central Harlem
233
0.4%
60702
85.8%
23.9%
$47,341
49.0%
Williamsburg/Greenpoint
318
0.4%
81292
37.0%
25.1%
$71,248
62.0%
Bedford-Stuyvesant
284
0.4%
64185
74.0%
20.2%
$47,706
43.9%
Park Slope/Carroll Gardens/Red Hook
281
0.4%
64161
35.7%
18.5%
$122,002
81.7%
East Flatbush/Farragut/Rugby
248
0.4%
61104
97.3%
52.3%
$52,291
29.2%
Sheepshead Bay/Gerritsen Beach/Homecrest
272
0.4%
62787
34.5%
51.8%
$60,814
46.7%
Soho/Battery Park City/Greenwich Village
261
0.3%
91456
27.7%
25.4%
$140,213
87.4%
Residents Working in Personal Care Services, by Neighborhood
Neighborhood
Number of Residents Employed in Personal Care Services Jobs
% of Employed Residents Working in Personal Care Services Jobs
Number of Employed Residents
% Non-White
% Foreign-Born
Median Household Income
%, Bachelor's degree or Higher
Flushing/Murray Hill/Whitestone
3799
3.9%
97267
74.6%
57.3%
$54,386
31.1%
Jackson Heights/North Corona
1985
2.5%
79042
89.6%
61.0%
$55,852
22.8%
Elmhurst/South Corona
1395
2.2%
62463
93.9%
64.1%
$49,078
25.5%
Sunset Park/Windsor Terrace
1326
2.1%
63248
75.6%
48.4%
$55,317
36.5%
Bedford Park/Fordham North/Norwood
1037
2.0%
50942
94.2%
46.6%
$35,535
17.8%
Washington Heights/Inwood
1998
2.0%
98999
81.2%
48.9%
$52,051
40.3%
Woodlawn/Williamsbridge/Wakefield
1010
1.9%
51807
93.6%
43.0%
$51,581
30.1%
Forest Hills/Rego Park
1021
1.9%
52445
52.3%
52.0%
$74,618
63.6%
Sheepshead Bay/Gerritsen Beach/Homecrest
1222
1.9%
62787
34.5%
51.8%
$60,814
46.7%
Concourse/Highbridge/Mount Eden
976
1.9%
51341
98.1%
45.6%
$29,938
19.1%
Belmont/Crotona Park East/East Tremont
990
1.8%
54675
96.0%
32.8%
$25,595
17.3%
Morris Heights/Fordham South/Mount Hope
750
1.6%
48231
98.9%
44.9%
$26,976
14.3%
Bensonhurst/Bath Beach
1249
1.5%
80984
59.9%
57.2%
$53,198
35.7%
New Springville/South Beach
823
1.5%
55102
33.9%
30.1%
$81,479
40.1%
Bay Ridge/Dyker Heights
807
1.4%
55959
45.4%
40.6%
$67,986
49.8%
Bayside/Douglaston/Little Neck
675
1.4%
47244
60.7%
44.6%
$82,805
48.9%
Far Rockaway/Breezy Point/Broad Channel
569
1.4%
41623
65.7%
27.8%
$53,968
37.1%
Prospect Heights/Crown Heights North
871
1.4%
64085
77.7%
29.2%
$52,917
50.7%
Riverdale/Kingsbridge
582
1.3%
43159
67.6%
34.6%
$59,995
44.6%
Tottenville/Great Kills/Annadale
886
1.3%
67296
17.2%
17.1%
$91,431
42.1%
Hamilton Heights/Manhattanville/West Harlem
777
1.3%
59161
72.5%
36.6%
$50,867
53.2%
Ridgewood/Glendale/Middle Village
1127
1.3%
85867
48.2%
40.6%
$73,644
33.2%
Sunnyside/Woodside
926
1.3%
70714
71.1%
55.5%
$66,705
44.3%
East New York/Starrett City
755
1.2%
60799
96.2%
37.1%
$37,999
18.7%
Lower East Side/Chinatown
851
1.2%
68605
66.6%
35.6%
$43,705
60.5%
Port Richmond/Stapleton/Mariner's Harbor
846
1.2%
69060
62.2%
26.1%
$64,666
35.7%
Castle Hill/Clason Point/Parkchester
830
1.2%
69244
97.1%
35.3%
$40,114
21.4%
Central Harlem
727
1.2%
60702
85.8%
23.9%
$47,341
49.0%
East Flatbush/Farragut/Rugby
724
1.2%
61104
97.3%
52.3%
$52,291
29.2%
Brownsville/Ocean Hill
479
1.2%
41181
97.4%
31.6%
$28,862
21.5%
Briarwood/Fresh Meadows/Hillcrest
768
1.2%
66125
69.9%
47.1%
$65,679
43.3%
Richmond Hill/Woodhaven
744
1.2%
64591
82.3%
52.9%
$67,914
30.7%
Flatbush/Midwood
756
1.1%
69159
59.3%
43.1%
$55,569
41.4%
Borough Park/Kensington/Ocean Parkway
594
1.1%
54414
28.9%
31.4%
$47,294
33.9%
Williamsburg/Greenpoint
876
1.1%
81292
37.0%
25.1%
$71,248
62.0%
Pelham Parkway/Morris Park
537
1.1%
50561
78.0%
37.5%
$50,877
28.9%
Bushwick
652
1.0%
62883
81.1%
32.3%
$47,569
40.6%
Brighton Beach/Coney Island
423
1.0%
41264
44.1%
54.0%
$38,065
42.5%
Bedford-Stuyvesant
634
1.0%
64185
74.0%
20.2%
$47,706
43.9%
Midtown East/Murray Hill/Gramercy/Stuyvescant Town
851
1.0%
88275
30.4%
24.5%
$117,921
88.2%
Howard Beach/Ozone Park
517
0.9%
56009
78.1%
46.5%
$72,400
27.8%
Jamaica/Hollis/St. Albans
850
0.9%
94580
98.2%
43.1%
$62,228
24.4%
East Harlem
418
0.9%
48371
86.3%
25.1%
$33,564
42.9%
Astoria/Long Island City
741
0.9%
85770
51.8%
41.2%
$63,592
57.4%
Co-op City/Pelham Bay
375
0.8%
45956
72.5%
22.0%
$59,798
32.7%
Hunts Point/Longwood/Melrose
398
0.8%
48810
97.9%
30.8%
$24,849
16.5%
Soho/Battery Park City/Greenwich Village
726
0.8%
91456
27.7%
25.4%
$140,213
87.4%
Canarsie/Flatlands
686
0.7%
91611
77.3%
42.8%
$74,840
37.4%
Prospect Lefferts/Wingate/Crown Heights S
380
0.7%
50836
77.2%
43.1%
$50,765
39.5%
Queens Village/Cambria Heights/Rosedale
447
0.6%
77144
89.1%
44.0%
$85,266
33.6%
Brooklyn Heights/Fort Greene
420
0.6%
73489
53.6%
20.6%
$93,434
72.4%
Midtown/Chelsea
533
0.6%
95899
40.5%
31.3%
$104,801
81.2%
Park Slope/Carroll Gardens/Red Hook
346
0.5%
64161
35.7%
18.5%
$122,002
81.7%
West Side/Upper West Side
467
0.5%
99276
31.8%
24.2%
$117,421
82.6%
Upper East Side
406
0.3%
118648
24.7%
24.0%
$120,868
87.8%
Notes
1. For this report, we conduct an analysis of occupation data from the U.S. Census Bureau's 2018 American Community Survey 5-Year Estimates, on the borough and neighborhood level, to assess where the city's hardest-hit workers in the restaurants, retail trade, accommodations, and personal care services industries live and work. We leverage the 2018 census occupational classification system in conjunction with the Census Bureau's Public Use Microdata Areas — which line up with the city's 59 community districts. Please note we use restaurants as shorthand for the “food services and drinking places” sector and hotels as shorthand for the accommodations sector.
The included occupations are as follows:
Restaurants/Food Services: Food service managers; Chefs and head cooks; First-line supervisors of food preparation and serving workers; Cooks; Bartenders; Food preparation workers; Fast food and counter workers; Waiters and waitresses; Food servers, nonrestaurant; Dining room and cafeteria attendants and bartender helpers; Dishwashers; Hosts and hostesses, restaurant, lounge, and coffee shop; Food preparation and serving related workers, all other.
Retail: Wholesale and retail buyers, except farm products; First-line supervisors of retail sales workers; First-line supervisors of non-retail sales workers; Cashiers; Counter and rental clerks; Parts salespersons; Retail salespersons; Sales representatives of services, except advertising, insurance, financial services, and travel; Sales representatives, wholesale and manufacturing; Door-to-door sales workers, news and street vendors, and related workers; Sales and related workers, all other.
Accommodations: Lodging managers; Baggage porters, bellhops, and concierges; Tour and travel guides; Travel agents; Hotel, motel, and resort desk clerks; Reservation and transportation ticket agents and travel clerks.
Personal Care Services: Barbers, Hairdressers, hairstylists, and cosmetologists; Manicurists and pedicurists; Skincare specialists; Other personal appearance workers; Personal care and service workers, all other.
2. Citywide, 67.8 percent of the population is non-white and 38.6 percent is foreign born.
General operating support for the Center for an Urban Future has been provided by The Clark Foundation and the Bernard F. and Alva B. Gimbel Foundation. CUF is also grateful for support from Fisher Brothers and Winston C. Fisher for the Middle Class Jobs Project.