


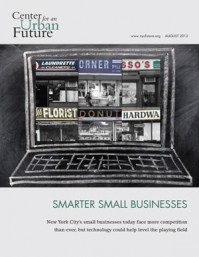
Report - August 2012
Smarter Small BusinessesThis report finds that far too many of NYCs small businesses still arent using websites, online ads and other technology tools, a huge missed opportunity at a time when small firms face increasing competition from national chains and online companies.
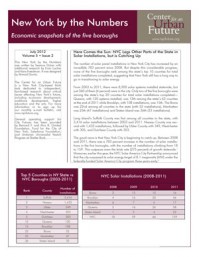
Report - July 2012
Here Comes the SunThis edition of New York by the Numbers reveals that New York City lags behind the rest of the state when it comes to installing solar energy panels in residential, commercial and government buildings, but is beginning to catch up.

Commentary/Op-Ed - July 2012
GED® change will be costly for N.Y.In July 2012, the Albany Times Union published an op-ed by our senior fellow Tom Hilliard which notes that beginning in 2014 the GED® exam will cost twice as much to take and be significantly more difficult to pass, changes that will almost certainly lead to significantly fewer New Yorkers getting their GED® credential. Already, New York is 49th out of 50 states in the GED® pass rates. In the op-ed, Tom urges New York State education officials and legislators to explore alternatives to the GED® test.

Testimony - June 2012
Keeping Up with the BoroughsThe New York City Council held a hearing that was prompted by the Center for an Urban Future's 2011 "Behind the Curb" report, which documented that New York City's public transit service has not kept pace with recent job growth and transit ridership gains in the Bronx, Brooklyn, Queens and Staten Island. The Center commended the Council's Transportation Committee for convening the hearing, which is titled "Keeping Up with the Boroughs—Addressing Public Transit Needs Outside Manhattan."

impact - June 2012
CUF Report Leads to NYC Council Hearing About Transit Gaps Outside of ManhattanOn Tuesday, the New York City Council’s Transportation Committee held a hearing titled “Keeping Up with the Boroughs—Addressing Public Transit Needs Outside Manhattan,” that was prompted by the Center’s 2011 Behind the Curb report.

impact - June 2012
CUF Influences City’s New Broadband PlanLast month, the Center published New Tech City, a report which documented the spectacular rise of New York City's tech sector over the past few years but highlighted a handful of challenges that could inhibit the continued growth of this part of the city's economy. The report cited inadequate broadband connectivity as the second biggest threat facing New York’s tech sector. Yesterday, Mayor Bloomberg and City Council Speaker Christine Quinn unveiled a package of proposals to expand broadband connectivity in New York as a way of bolstering the city’s tech sector.
Page 110 of 158 pages ‹ First < 108 109 110 111 112 > Last ›