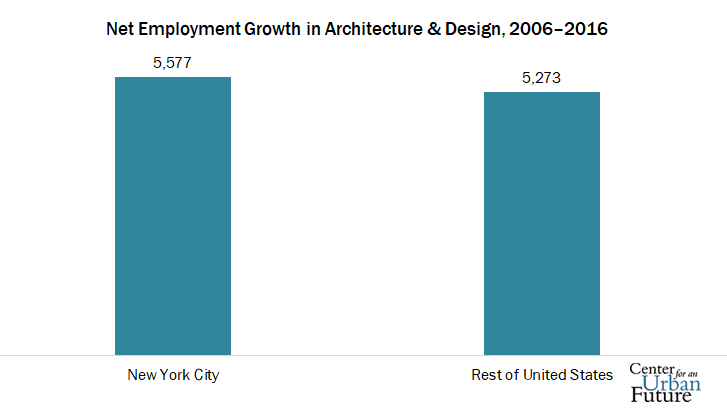
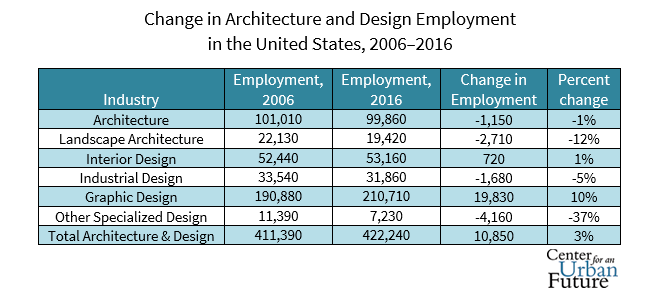
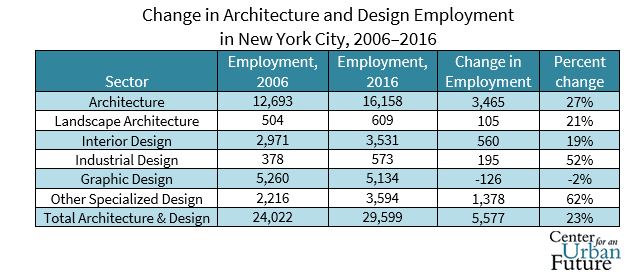
Seven years ago, the Center for an Urban Future released a report documenting the economic importance of the design sector to New York City’s economy. This data brief, published as the city’s sixth annual design week kicks off, offers a new look at the city’s outsized role in the U.S. design economy. Our analysis finds that of the 10,850 architecture and design jobs added nationally between 2006 and 2016, 5,577 have been in New York City—meaning one in two of the country’s new architecture and design jobs has been created in the five boroughs.1
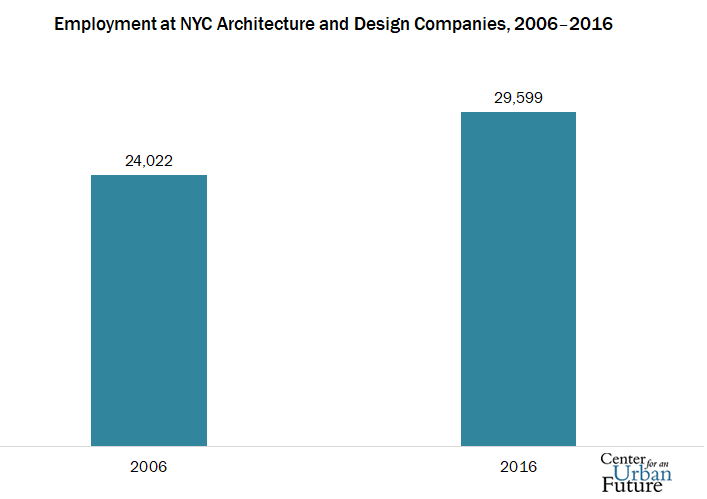
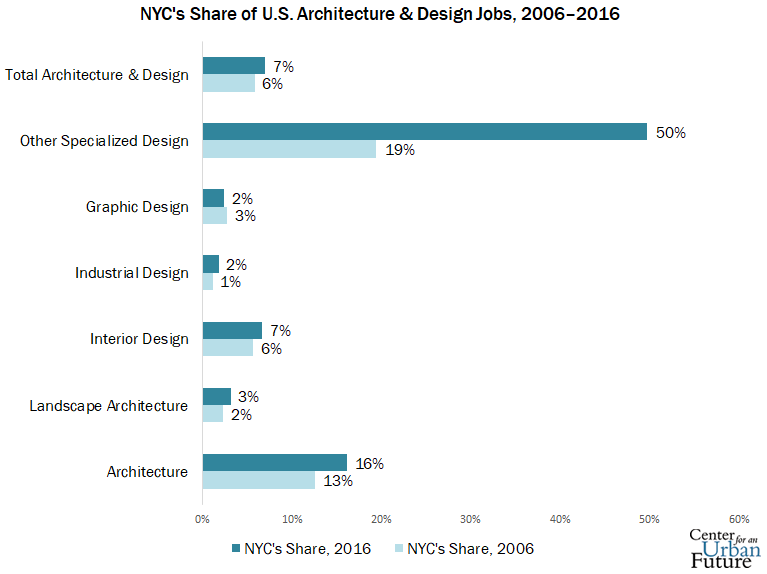
New York City had 29,599 architecture and design workers in 2016, according to data from the U.S. Bureau of Labor Statistics (BLS)—7 percent of the nation’s 422,240 architecture and design jobs, up significantly from a decade ago, when the city accounted for 5.8 percent.
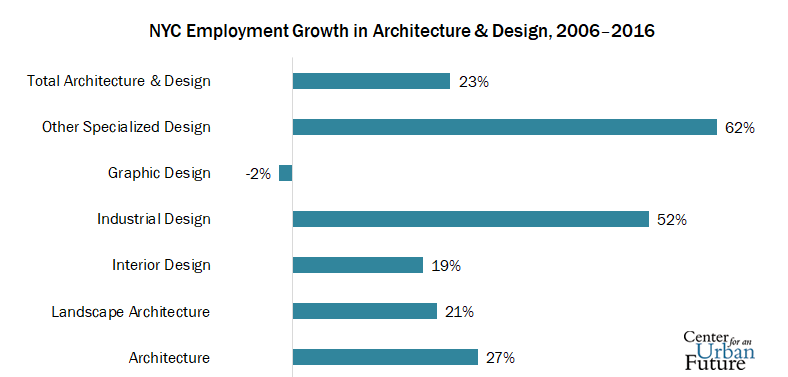
In New York, architecture and design jobs have increased at a significantly faster pace than in the rest of the country. Architecture and design jobs grew by 23 percent from 2006 to 2016, compared to a 3 percent increase in the United States overall. The number of architecture and design firms in the city also grew by 16 percent, to 575 firms, between 2006 and 2016. Of all design fields, only graphic design saw a slight decrease in the number of employees—but BLS estimates that about 1 in 5 graphic designers were self-employed in 2016, and the survey doesn’t count freelancers. This data brief includes New Yorkers employed in architecture, landscape architecture, interior design, industrial design, graphic design, and other specialized design.
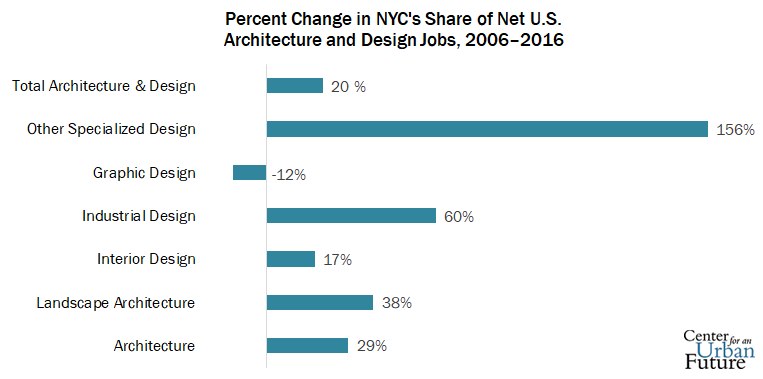
Today one in six of the nation’s architecture jobs is in New York City, as well as half of all jobs in “other specialized design” (a category that includes fashion, costume, and jewelry design). New York City has increased its share of jobs in nearly every design field, led by a 156 percent increase in the share of all other specialized design jobs, a 60 percent increase in the share of all industrial design jobs, and a 38 percent increase in the share of all landscape architecture jobs.
Manhattan is home to 87 percent of the city’s architecture and design jobs, but as CUF first reported two years ago, Brooklyn is driving New York’s growth. Brooklyn’s design economy hasn’t just increased over the past decade—it’s multiplied. Between 2006 and 2016, Brooklyn almost tripled its architecture and design jobs, from 942 to 2,589. Even the slowest-growing categories—interior design and other specialized design—doubled employment in Brooklyn over the past decade. In the borough, the number of employees in industrial design (which designs products meant for mass production, from surgical equipment to toasters) increased 779 percent, to 187 in 2016 from 24 ten years earlier. The number of graphic design jobs quadrupled, to 823 from 202. As of 2016, Brooklyn had more graphic design jobs than 29 states, including Arizona, Utah, Kentucky, and Washington, DC.
All data in this analysis comes from the U.S. Bureau of Labor Statistics, Quarterly Census of Employment and Wages (QCEW). Data is calculated through 2016, which is the most recent period for which QCEW data is available.
1. These figures reflect net change in employment, given that jobs in each industry are both created and eliminated in any given year.
Photo Credit: Dorian Mongel /Unsplash