The following are the Key Findings from Re-Envisioning New York's Branch Libraries.
Read the full report (PDF).
View the charts and tables from the report.
Key Findings
New York City’s public library buildings are very old.
-
The average branch library in New York City is 61 years old, with the oldest buildings concentrated in Manhattan, where the average age is 84, and Brooklyn where it is 65. In Staten Island the average age of library buildings is 61, in the Bronx 57 and in Queens 47.
-
A quarter of the city’s libraries—52 branches—are at least 100 years old. 159 branches are at least 40 years old.
-
Only 15 new library buildings have been built in the past 20 years. Six of these newest buildings are in Queens.
-
Much of the city’s library development occurred during two eras: the Carnegie era (1902—1929), when 54 of today’s branches were built, mostly through a grant from the Carnegie Corporation, and Mayor John Lindsay’s administration (1966—1973), when 53 branches were designed or built.
The libraries’ aging infrastructure, combined with decades of insufficient city capital funding, has resulted in a maintenance crisis.
-
The three library systems have identified nearly $1.1 billion in capital needs, of which about $812 million is needed simply to keep their buildings in good working condition. The remaining $278 million is for new construction and branch expansions.
-
Fifty-nine branches have $5 million or more in repair needs.
-
Across the city, 64 branches need HVAC repairs or replacements, 55 need roof repairs, 55 need to be made ADA compliant, 35 need boiler repairs or replacements, 32 need electrical system upgrades, and 23 need new elevators.
-
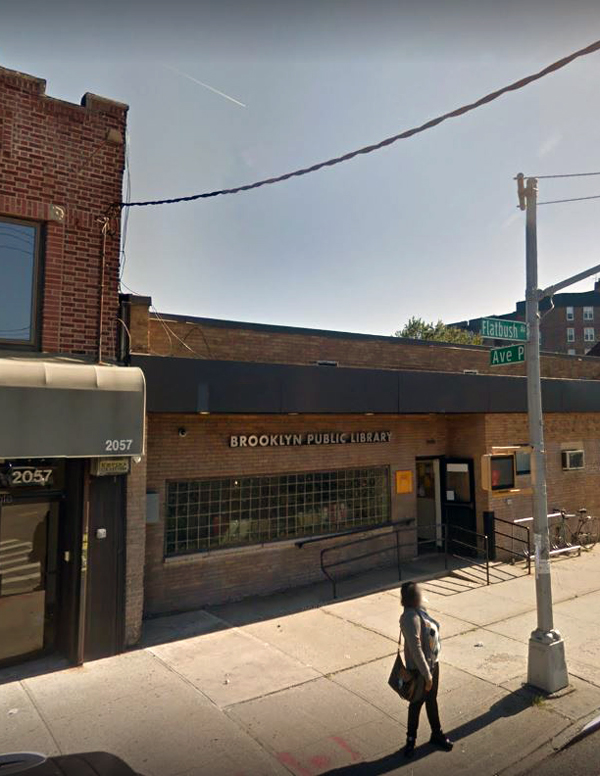
Brooklyn libraries are in particularly bad shape: 51 of the system’s 59 branch buildings (or 86 percent) have over $1 million in state of good repair needs. Mainly due to malfunctioning heating and cooling systems, the borough’s branches had 140 unplanned closures, adding up to 540 lost service hours, in 2013.
Too many library branches are not configured to adequately meet the needs of today’s patrons.
-
At a time when computers and mobile devices are required for even basic work or study, most libraries don’t have enough functional and accessible electrical outlets for users on their devices. Of the 45 libraries we visited, 26 had 10 outlets or fewer.
-
The libraries’ community rooms are often unable to accommodate the growing demand for classes, homework help, after-school programs and other important library activities. The rooms they do have for programming often double as storage, need repairs, and lack sufficient equipment, such as Wi-Fi and furniture.
-
In our survey of more than 300 librarians across the five boroughs, 86 percent said that their community rooms are insufficient to meet the needs of patrons.
-
Although libraries are asked to support a greater number and variety of activities, their spaces have not adapted to meet these demands. Seventy-four percent of our survey respondents said they needed more quiet space, and 60 percent said they couldn’t adequately accommodate people working in groups,
-
Many libraries simply don’t have enough seating to accommodate the increasing number of patrons looking for a place to sit down and work. Twenty-two of the 45 branches we visited in our site surveys had seating for fewer than 50 people. McKinley Park in Brooklyn and Jackson Heights in Queens each have over 375,000 annual visitors, but McKinley Park can only seat 48 patrons and Jackson Heights 76.
The majority of library branches are simply too small to accommodate the increased demand for onsite activities.
-
The average size of New York City’s branch libraries, excluding the much larger Mid-Manhattan Library and the Brooklyn and Queens central libraries, is 12,200 square feet.
-
One hundred of the city’s 207 branches are 10,000 square feet or smaller; 75 branches are under 8,000 square feet.
-
Queens has the largest share of small branches—41 are under 10,000 square feet, compared with 26 in Brooklyn, 14 in the Bronx, seven in Staten Island and six in Manhattan.
The lack of space in most city branches is exacerbated by the often inefficient use of space.
-
Seventy-seven branches use 30 percent or more of their space for utilities and administrative purposes, while 26 branches use 40 percent or more.
-
No New York City library built since 2000 uses more than 30 percent of its space for administration and utilities, and many newer libraries use 20 percent or less for these purposes.
-
Fourteen branches have custodial apartments averaging 1,000 square feet that have been shuttered for decades. Twelve other branches have unused basements, rooms or entire floors.
-
In order to open up these spaces, major renovations are necessary to bring them up to code and make them ADA accessible.
Capital funding levels for libraries have been woefully insufficient to cover basic building needs.
-
Between fiscal years 2004 and 2013, the city spent $503.7 million on capital improvements for public libraries. Although that sum represented an increase over the ten years prior, it has not come close to meeting the libraries’ extensive needs. Of the libraries’ $1.1 billion in current capital priorities, all but a very few have still not received any capital funding.
-
Despite having over $300 million in state of good repair needs, the Brooklyn Public Library received just $20.9 million in capital funds in fiscal year 2014.
-
Due to insufficient funding, all three libraries have to depend on the City Council and the borough presidents for a majority of their capital funds. Between fiscal years 2004 and 2013, the Brooklyn Public Library received just $39 million in capital funds from the mayor. Over the same ten year period, the Queens Library received $43 million and NYPL $99 million from the mayor.
Capital funding for libraries is largely based on a discretionary, political process, creating an insufficient and haphazard pattern of repair.
-
Between fiscal years 2004 and 2013, 59 percent of the libraries’ capital commitments came from the City Council and borough presidents, and only 41 percent came from the mayor. No other city agency relies so heavily on the discretionary dollars of City Council members and borough presidents.
-
While parks, senior centers, cultural institutions and other city entities also receive capital dollars from borough presidents and council members, only the public libraries receive a majority of their capital allotment from discretionary sources.
-
The discretionary process leads to enormous geographic discrepancies in funding. Between fiscal years 2010 and 2014, libraries in Queens received $50 million in capital funds from its borough president. Over the same period, Bronx libraries received just $5.6 million from its borough president, Brooklyn libraries $4.4 million, Manhattan libraries $3 million and Staten Island libraries $511,000.
Delays and high costs make it extremely difficult to repair and modernize libraries.
-
According to data collected by NYPL, the average duration for major renovations that are managed by the city is 6.69 years, compared to 1.97 years when similarly sized projects are managed by NYPL itself.
-
The total cost per square feet for city-managed renovations is $616, compared to $412 for NYPL-managed projects of similar size and scope. City-managed new construction costs $1,262 per square foot, compared to $642 for projects managed by NYPL.
-
Library projects move out of the city’s commitment plan, which includes only fully funded and authorized projects, into the bidding and contracting process at a much slower rate than most other agencies. On average, just 21 percent of library projects each year move out of the commitment plan to become a registered contract with the city comptroller, compared to 45 percent for all city agencies and 32 percent for cultural groups.
Read the full report (PDF).