
Data - March 2016
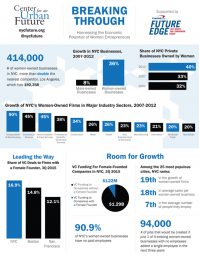
Data from Breaking ThroughCharts and tables from our 2016 Breaking Through study. The report found that though women entrepreneurs of all ages, races and ethnicities are having an increasingly large impact on New York City’s economy, the city has only begun to harness the full potential of women entrepreneurs.

Data - November 2015
Manufacturing in NYC: A SnapshotThis data analysis, the inaugural publication of the Center for an Urban Future’s Middle Class Jobs Project, provides a new level of detail about New York City’s manufacturing sector. It reveals that the city has gained nearly 1,000 manufacturing jobs since 2011, reversing a long decline, and documents which manufacturing subsectors in the five boroughs are growing the fastest.
Data - October 2015
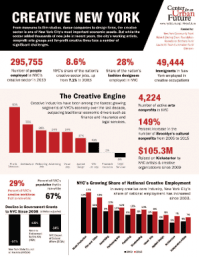
Creative New York, At A GlanceFrom museums to film studios, dance companies to design firms, the creative sector is one of New York City’s most important economic assets. Using data from CUF's 2015 Creative New York report, this infographic shows the incredible growth, as well as the ongoing challenges of the city’s creative industries.

Data - August 2015
NYC’s Tech ProfileThis analysis offers a fresh look at New York City’s tech sector. Using the Federal Reserve Bank of New York’s new definition of tech industries, our analysis documents employment growth by borough and subsector and offers a demographic profile by age, sex and race/ethnicity.

Data - July 2015
Parks Facilities, How the Boroughs CompareNew York is home to the country’s oldest, busiest and most expansive parks. These facilities, however, are not equally distributed across the city’s neighborhoods and boroughs. In this data brief, we look at the per capita distribution of Department of Parks and Recreation pools, tennis courts, handball courts and baseball diamonds.
Data - June 2015
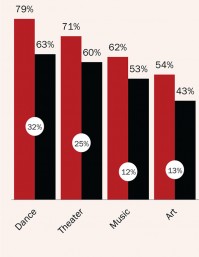
Data from Creative New YorkCharts and tables from our 2015 Creative New York study. The report found that the creative sector is one of New York City’s most important economic assets but that the city’s working artists, nonprofit arts groups and for-profit creative firms face a growing number of challenges.

Data - June 2015
NYC Libraries by the NumbersDespite declining funds and limited hours of service, New York City’s public libraries are seeing a surge in users and uses. Below we show where the growth is happening and how funding cuts in recent years have affected performance, and provide the city’s first branch-by-branch accounting of book circulation, program attendance and visits.
Data - May 2015
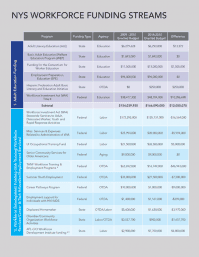
NYS Workforce Funding StreamsThese three tables from our Seeking a State Workforce Strategy report track public workforce development funds by program and relate these programs to three larger categories for investment: 1) adult education funding 2) workforce development funding and 3) college access and workforce services in higher education. The tables also indicate where programs receive their funding, what agency or department oversees them and how their funding has changed in the past five years.