

Data - May 2026
Ten Years of CS4AllNew York City's landmark Computer Science for All (CS4All) initiative launched a decade ago. This data brief illuminates its achievements, persistent disparities in access to computing education, and the work that remains in this new era of AI to make computing education a core component of every student’s K–12 experience.

Data - May 2025
The Emerging Financial Security Crisis Facing NYC’s Older AdultsA growing number of older New Yorkers are facing a financial security crisis, with poverty on the rise, retirement income out of reach, and stark racial and borough-level disparities compounding the challenge. This new analysis reveals the scope of the crisis and urges action to support the city’s rapidly aging population.

Data - November 2024
It’s Time to Launch SUNY ReconnectNew York State is home to 1.5 million working age adults who have already earned some college credits but have not completed a degree. State policymakers should launch an initiative, SUNY Reconnect, that can help adults in every corner of the state to re-enroll at SUNY, complete their degrees, and boost their chances at economic mobility.

Data - June 2024
Expanding Access to Advertising Careers in NYCTo make progress toward a more equitable economy in New York, it will be crucial to expand access to careers in several growing middle- and high-wage industries that employ alarmingly few New Yorkers of color. Advertising is one sector where progress is both needed and possible.

Data - May 2024
Preparing for the End of the Affordable Connectivity Program in New York CityFew places nationally have benefited from the Affordable Connectivity Program (ACP) as much as New York City. With full funding for the program expiring at the end of April, nearly one million households across the five boroughs are poised to lose this subsidy—with the most significant impact felt in the city’s lowest-income communities.

Data - June 2022
Greening City Buildings: More Progress Is Needed to Meet NYC’s Municipal Emissions Reduction GoalsWhile greenhouse gas emissions from city-owned buildings have decreased since 2014, this new analysis reveals 8 of 25 city agencies have seen emissions increase, including a 15 percent spike at CUNY. More progress will be needed to achieve the city’s goal of net-zero carbon emissions by 2050.
Data - December 2021
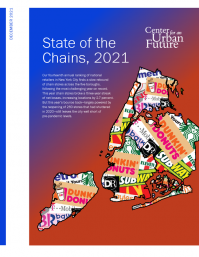
State of the Chains, 2021Our fourteenth annual ranking of national retailers in New York City finds a slow rebound of chain stores across the five boroughs, following the most challenging year on record. This year chain stores broke a three-year streak of net losses, increasing locations by 2.7 percent. But this year’s bounce back—largely powered by the reopening of 260 stores that had shuttered in 2020—still leaves the city well short of pre-pandemic levels.
Data - November 2021
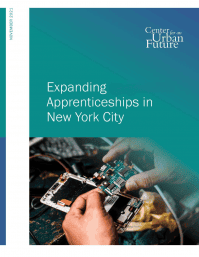
Expanding Apprenticeships in NYCWhile New York State has made significant progress in expanding apprenticeships since 2018, New York City has seen little growth. With renewed support, the city has the opportunity to leverage this high-impact training model and make apprenticeships in high-growth industries like tech and healthcare a key component of an inclusive economic recovery.

Data - November 2021
Before the Next Flood: NYC Needs More Progress Building Green InfrastructureWhile the city has made significant progress in ramping up the construction of green infrastructure, it has fallen short of state-mandated targets and struggled to finish construction on thousands of green infrastructure assets in a timely manner. The next administration needs to expand its goals and accelerate construction throughout the city.

Data - March 2017
The Unkindest Cuts: New York Has the Most to Lose if the NEA Is AbolishedThe Trump administration's plans to dismantle the National Endowment for the Arts will hurt hard-working artists across the country. Nowhere will these cuts be felt more deeply than in New York City, which receives one out of five NEA grants, worth $15.5 million in 2016. These funds support everything from major museum exhibitions to upstart performance groups, and, above all, good jobs for thousands of New Yorkers.

Data - March 2017
Taking to TASC: Too Few New Yorkers Are Passing the High School Equivalency ExamAfter the New York State Department of Education switched from the GED to a new high school equivalency exam, TASC, in 2014, the number of New York adults obtaining their HSE fell by half. The Center’s report is a first-ever look at the number of the New Yorkers that are taking and passing the new HSE exam since New York State changed test providers.

Data - October 2016
Where Immigrant New Yorkers Go to WorkImmigrants form an essential part of New York City's workforce. This data brief reveals where the city's immigrants go to work, including industries with a surprisingly high proportion of immigrant workers and others where immigrants are almost completely left out.

Data - September 2016
Jobs in Transit: Opportunity in the Transportation SectorThe transportation sector is growing in New York City, creating opportunities for accessible middle-wage jobs across the five boroughs. This data brief, the latest publication of our Middle Class Jobs Project, documents the industry's recent job gains, which have outpaced the city's overall economic growth over the past two years.
Data - July 2016
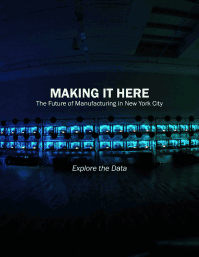
Data from Making It Here: The Future of Manufacturing in New York CityThe following data is part of CUF's 2016 Making It Here report. The report explores the new wave of modern manufacturing companies that are adding jobs across New York City, with a focus on three industries: 3D printing, wood and metal fabrication, and food.

Data - June 2016
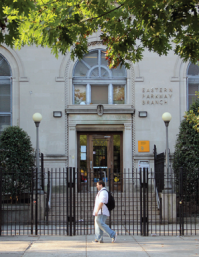
Libraries Teach Tech: Building Skills for a Digital WorldThis new data brief finds that NYC’s public libraries are playing an increasingly important role in helping New Yorkers develop the technology skills needed in today’s economy. It shows that the city’s libraries provided tech training to more than 150,000 New Yorkers in 2015, an 81 percent increase from just three years earlier.

Data - May 2016
The Rise (and Fall) of Middle Wage Industries in NYCWhile the share of middle income jobs in New York City has declined over the past couple of decades, there is evidence that industries with middle income wages are staging a bit of a comeback.

Data - May 2016
Brooklyn Design BoomOur new data brief highlights the growing importance of the design sector to New York City’s economy, and details that a disproportionate share of the growth in the sector is now occurring in Brooklyn. It shows that employment at architecture and design companies in Brooklyn increased by 86 percent between 2010 and 2014, significantly outpacing the growth citywide (23 percent) and in Manhattan (19 percent).
Data - March 2016
Library Times Are A-Changin’Our second annual assessment of library hours in New York shows that 40 percent more branch libraries in NYC are open at least six days a week than this time last year. But while city libraries are open an average of 4 hours more per week than a year ago, they still lag behind many of the largest library systems in the state and nation in hours of operation.

Data - March 2016
Fast City, Slow CommuteNew Yorkers are efficient, direct and fast moving. Their commutes: anything but. In this data analysis, we examine New Yorkers’ commutes by neighborhood and across industries.
Data - March 2016
Women-Owned Businesses in the Nation’s 25 Largest CitiesThis index provides data on women-owned businesses in each of the nation’s 25 largest cities, including the overall number of women-owned firms, the growth rate for women-owned businesses and male-owned businesses, and average revenues per women-owned business.