Click here to read the full report (PDF).
In the last six weeks alone, flash flooding shut down streets in Park Slope and Williamsburg, a software glitch brought subway trains to a halt during rush hour, a massive power outage left tens of thousands of city residents in the dark, and a Long Island City subway station was deluged with so much water that it knocked a straphanger off his feet. Though hardly at the same scale of infrastructure woes New York City experienced in New York in the 1980s—when the city closed the Williamsburg Bridge for fear of collapse, and track fires were a regular occurrence in the subway system—the recent wave of breakdowns is a troubling reminder of what can happen in a city where a large segment of the core infrastructure is decades old and overdue for basic upgrades.
In March 2014, the Center for an Urban Future documented an array of challenges and vulnerabilities resulting from the city’s aging infrastructure. Our report, titled Caution Ahead, revealed that many of the city’s roads, bridges, subway signals, water and sewer mains, and public buildings were more than 50 years old and in varying states of disrepair. And it identified a minimum investment of $47.3 billion over the next five years to bring the city’s core infrastructure to a state of good repair.
The events of the past month make it clear that the city’s aging assets still present a massive infrastructure challenge. If anything, the need has only been magnified as a result of unprecedented usage from a growing population and record tourism, and new stresses brought on by climate change.
This study provides a five-year update to our assessment of New York City’s aging infrastructure vulnerabilities. It concludes that the de Blasio administration’s record infrastructure investments have resulted in real progress in several areas, but also finds that capital needs across many city agencies have grown significantly—and not just in high-profile areas like the subways and NYCHA. Our new analysis shows that some of the problems we documented five years ago have only gotten worse, and that the new stressors like climate change have only added to the overall price tag to bring the city’s core infrastructure to a state of good repair.
KEY FINDINGS
- Over the past five years, Mayor Bill de Blasio and the City Council have significantly increased fouryear capital funding, from $26.7 billion in FY 2015 to an unprecedented $58.2 billion in FY 2020, adjusted for inflation.1
Increased capital investment—particularly in water and sewer infrastructure and street resurfacing—is beginning to show results. Our analysis finds that the following areas have shown signs of improvement since 2014:
- The city has accelerated its repair and replacement of aging water mains. In FY 2018 alone, 92.6 miles of water mains were upgraded, up from just 19.1 miles in FY 2010.
- The NYC Department of Environmental Protection (DEP) constructed or reconstructed 22.6 miles of sewers in FY 2017 and 25.6 miles in FY 2018, recording the highest mileage totals in a decade.
- The pace of street resurfacing has increased. Between FY 2014 and FY 2018, the city resurfaced an average of 1,182 lane miles per year—up from an average of just 852 miles per year between 2000 and 2013.2
But in other areas, conditions have gotten worse as needs have grown:
- The estimated state-of-good-repair needs at the eighteen city agencies analyzed in our original 2014 report have ballooned, increasing by 19 percent—from $6.6 billion for FY 2014–17 to $7.8 billion for FY 2018–21.
- While city funding has also increased during this period, fourteen of the eighteen agencies still have less than 40 percent of their four-year state-of-good-repair needs funded.
- Five city agencies have less than 20 percent of their four-year state-of-good-repair needs funded.
- Six agencies have a state-of-good-repair needs gap of at least $100 million. The NYC Department of Education (DOE) alone recorded a gap of over $1.5 billion, while the Parks Department had a gap of over $500 million.
- Capital needs at the DOE have nearly doubled since 2011, with four-year state-of-good-repair needs for city schools increasing from an inflation-adjusted $1.1 billion in 2011 to $2.1 billion in 2017.
- Planned spending at the DOE has not kept up with escalating repair needs, leading to a shortfall that has grown from an inflation-adjusted $865 million in 2011 to over $1.5 billion in 2017.
- CUNY’s four-year state-of-good-repair needs for 2017 topped $100 million, more than double the inflation-adjusted $47.6 million reported in 2011.3
- New York City Housing Authority (NYCHA)’s overall five-year capital needs increased over 70 percent to $31.8 billion in 2017, up from $18.3 billion in 2011 (adjusted for inflation).4
There are also areas of city infrastructure that are seeing improvement, but which still face enormous challenges:
- Although the city has ramped up the pace of water main replacement, there were still 522 water main breaks last year—the highest total in over a decade.5
- New York City’s bridges also show mixed results. The number of structurally deficient bridges—those in need of substantial maintenance and repair—has declined from 162 in 2013 to 142 in 2018,6 but the number of bridges that are also fracture critical—at risk of partial collapse—jumped from 47 in 2012 to at least 67 in 2018.7
The pages that follow go into significantly more detail about the city’s current infrastructure needs. Throughout our analysis, we find that the decisions made by Mayor de Blasio and the City Council to significantly increase the city’s capital investments are paying off and putting the city’s core infrastructure on stronger footing. But it is also evident that current investment levels will need to be sustained, not only to make up for decades of underinvestment but also to keep pace with increasing usage and new stresses. Doing so will be essential to keeping New York City a global leader into the twenty-first century.
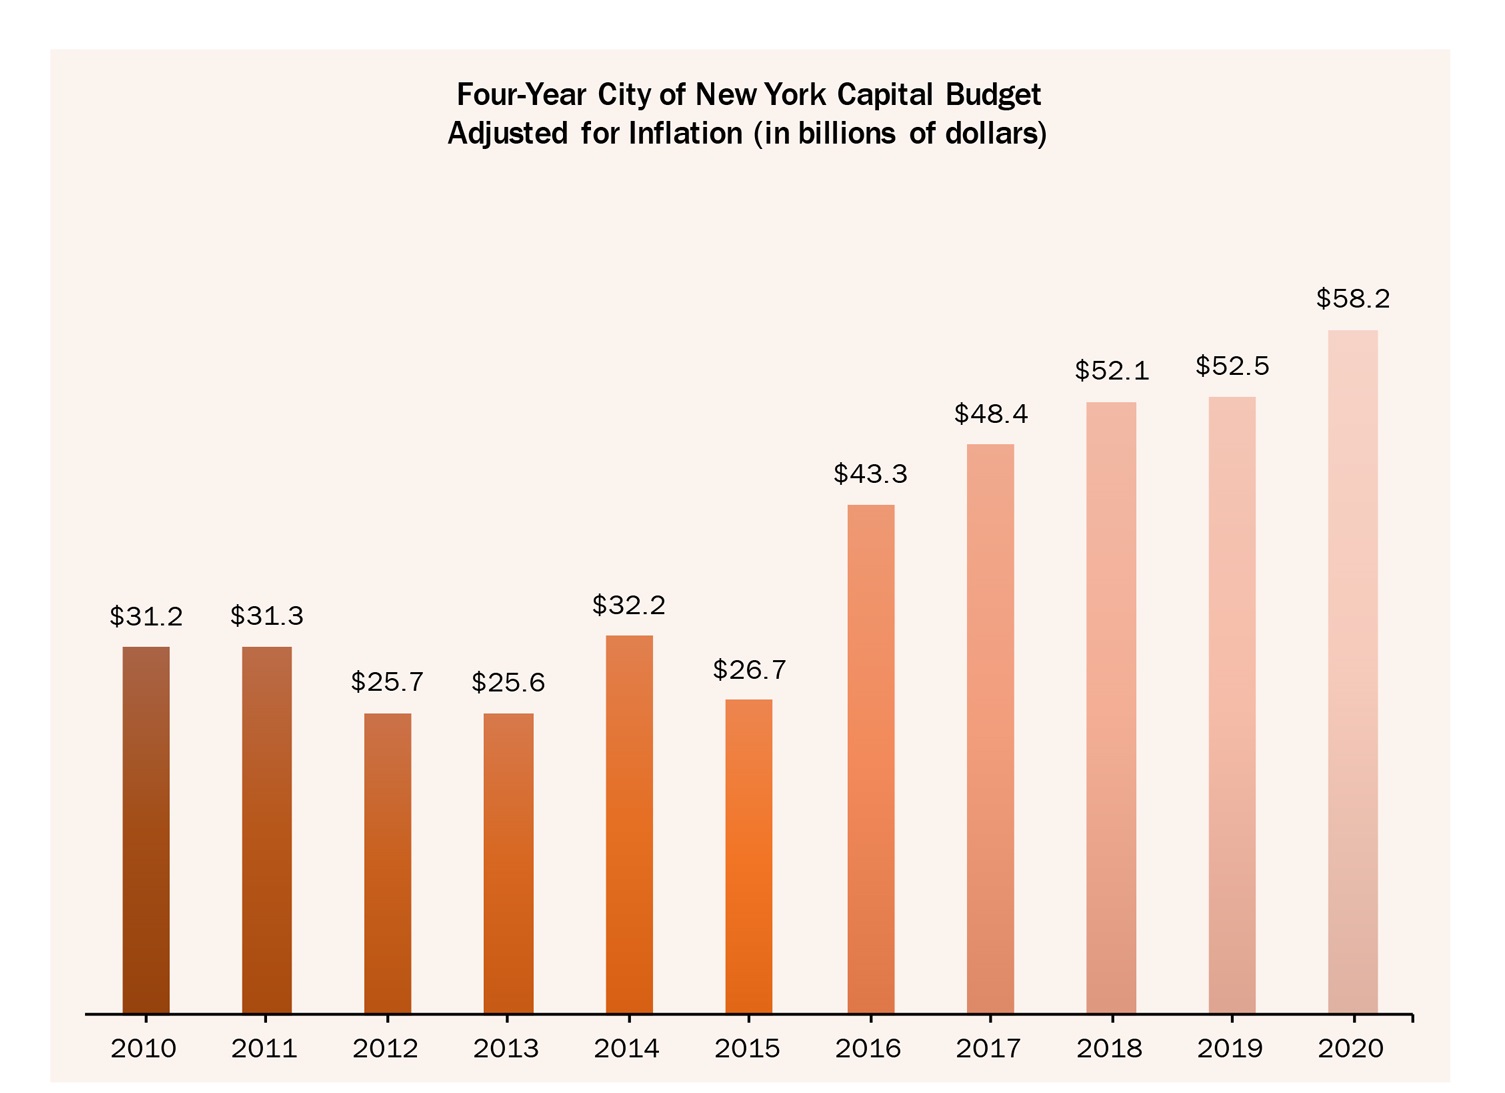
Source: City of New York Adopted Capital Budget, FY 2010–20
STREETS
New York City’s streets, roads, and highways serve far more than cars. They allow buses, bicyclists, and pedestrians to get around the city, and enable the transport of goods and the activity of first responders, all while protecting vulnerable underground infrastructure and guiding rainwater to catch basins. Yet over the past two decades, city streets have experienced significant deterioration. However, some progress has been made since 2014.
- Between FY 2000 and FY 2013, New York City met its resurfacing goal of 1,000 lane miles per year in only three years (FY 2009, FY 2011, and FY 2012).
- Since 2014, the pace of street resurfacing has increased. The de Blasio administration set a new internal goal of 1,300 lane miles per year, which the city reached for the first time in FY 2017.8
- In the past five years (FY 2014–18), an average of 1,182 lane miles have been resurfaced per year. The city surpassed the mayor’s 1,300 lane-mile benchmark in FY 2017 and FY 2018, and is on track to do the same in FY 2019.
- However, the number of lane miles reconstructed each year has fallen significantly over the past decade. From FY 2014 to FY 2018, the city reconstructed an average of 31.3 miles of street lanes per year, down from an average of 38.7 miles per year from FY 2010–13 and just half of the 62 lane miles per year, on average, that the city reconstructed from FY 2006–09.9 This is noteworthy because simply resurfacing streets is often inadequate to keep New York’s well-trafficked roads in good condition over the long run. Deterioration can reach below the road surface and affect the foundation. When this base structure is damaged, new asphalt will not last as long as it would otherwise, necessitating more frequent paving. Repairing the foundation requires replacing the roadway down to a foot or more below the street’s surface and usually includes reconstruction of the curbs and sidewalks as well.10
- Today, 28.6 percent of New York City’s street lanes are in “fair” condition, meaning street surface distress (cracking) is clearly visible, or “poor” condition, meaning distress is frequent and severe. That’s an improvement from 2013, when 30.4 percent of roads were rated fair or poor. However, street ratings remain significantly below the level recorded in 2000, when 15.7 percent of streets were assessed fair or poor.11
- Highway conditions have improved in recent years. Since 2012, the share of highway lanes rated fair or poor has decreased in every borough. Staten Island saw the greatest improvement, going from 60 percent of lanes rated in fair or poor condition in 2012 down to just 18 percent of lanes in 2017.
- Although every borough has seen improvements in highway conditions since 2012, the conditions in two boroughs—the Bronx and Manhattan—remain worse than in 2008. Manhattan now fares the worst of any borough, with 44 percent of highway lanes rated fair or poor in 2017, up from just 28 percent in 2008.12
.jpg)
*Figures for FY 2019 are preliminary target mileage, neither confirmed nor certified
Source: Mayor’s Management Report, FY2000–2018; Preliminary Mayor's Management Report, FY2019
.jpg)
Source: Mayor’s Management Report, FY 2000–2018
.jpg)
Source: New York State Department of Transportation (NYSDOT), Pavement Data Report Region 11, 2017
BRIDGES
New York City is an archipelago crisscrossed by rivers, creeks, canals, and estuaries, train tracks, highways, parks, and roads. The city’s 1,444 bridges are essential to how the city functions, connecting transportation routes, neighborhoods, and boroughs. But they’re also aging rapidly, and many are now used in ways for which they were never designed.
- The city’s 1,444 bridges are 68 years old on average, with 210 bridges built more than a century ago.
- 1,175 bridges (81.4 percent) are at least 50 years old; 552 are at least 75 years old.
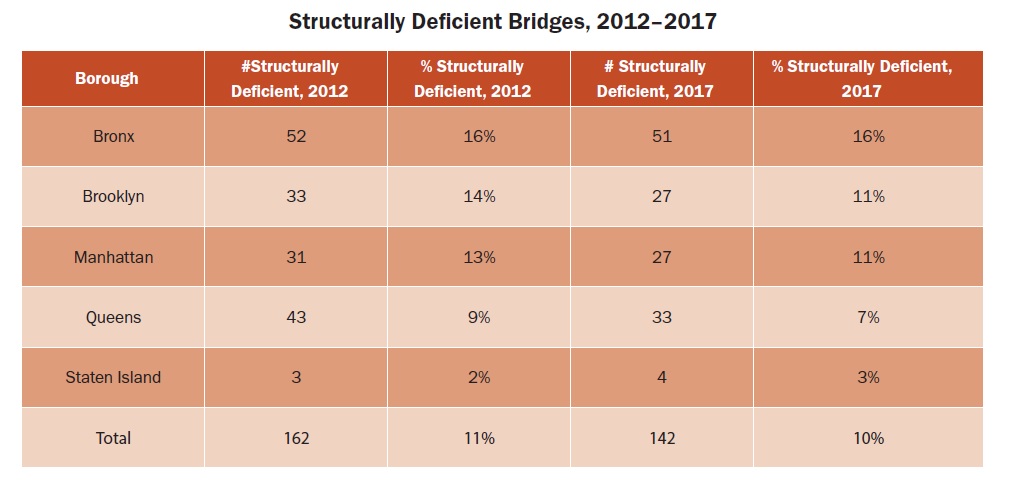
- The number of bridges across the city assessed by the New York State Department of Transportation (NYSDOT) as “structurally deficient” has declined from 162 in 2012 to 142 in 2018, a clear sign of progress.
- The Bronx has the greatest number and highest percentage of structurally deficient bridges, at 51 (16 percent). That’s roughly the same number as in 2012, when 52 bridges in the borough were determined to be structurally deficient.
- Since 2012, the average condition rating of NYC’s bridges is relatively stable, dropping from 4.98 to 4.97 on the seven-point scale used by NYSDOT.13
- While fewer bridges are structurally deficient, the number of bridges that are fracture critical— the most pressing issue—has increased significantly, from 47 in 2012 to 67 in 2018.14 Bridges that are fracture critical are those which have a tension member, such as a cable, truss, or bracing whose failure would probably cause part or all of the bridge to collapse.15
.jpg)
Source: Save Our Bridges data on Structurally Deficient and Fracture Critical Bridges, http://saveourbridges.com/, accessed May 17, 2019
.jpg)
Source: NYSDOT Bridge Conditions, https://data.ny.gov/Transportation/Bridge-Conditions-NYS-Department-of-Transportation/wpyb-cjy8, accessed February 19, 2019
Source: NYSDOT Bridge Conditions
.jpg)
Source: NYSDOT Bridge Conditions
WATER MAINS
In keeping with the policy recommendations in our 2014 Caution Ahead report, the de Blasio administration’s Underground Infrastructure Working Group recommended prioritizing water and sewer utility infrastructure, and those new priorities have started to yield results.16 The New York City Department of Environmental Protection (DEP) operates, manages, and maintains a massive water system that extends 125 miles north and west of the city and has a storage capacity of over half a trillion gallons. In this update, CUF focuses on the maintenance of the approximately 7,000 miles of municipal water mains and pipes.17
- DEP has significantly ramped up the pace of water main replacement in the past two years. In FY 2017, 62.5 miles of water mains were replaced, and in FY 2018 92.6 miles were replaced, exceeding a state-of-good-repair goal of 68 miles, which is equivalent to 1 percent of the entire system.
- By comparison, between FY 2014 and FY 2016, the city replaced an average of just 33.6 miles of water mains per year, above the average of 27 miles from FY 2003–13, but well below the stateof-good-repair target.
- But even with the increased replacement rate in FY 2018, there were 522 water main breaks the same year, the highest total since FY 2007 (581 breaks) and a 23 percent increase from FY 2017 (425). DEP attributes the jump to an increase in the number of freeze-thaw cycles, the type of volatile weather changes which will only increase in frequency and severity as a result of climate change.18
- Though weather may have had an effect on the system, the fact is that from FY 2008–18, DEP has replaced just 418 miles of water mains, 262 miles behind the target replacement rate and a shortfall of over 38 percent. Over the same period, the city has recorded an average of over 500 water breaks per year.19
.jpg)
Source: Mayor’s Management Report, FY 2003–2018
WATER TUNNEL NO. 3
- Water Tunnel No. 3 is a major and complex infrastructure project which broke ground in 1970. Tunnel No. 3 reached a major milestone with the completion of the Manhattan Leg of Stage 2 in 2013. Stage 2 of Tunnel No. 3 was scheduled for completion in 2021, but activation of the Brooklyn/Queens section of Stage 2 was deferred in FY 2015 and FY 2016, and only in FY 2017 did the project receive an additional $702.7 million in funding for its completion.20 When the Brooklyn and Queens legs are completed, 60 miles of tunnels will be added to the city’s drinking water system, taking a load off the two existing tunnels and adding much needed redundancy. Based on our analysis of current capital strategy, Stage 2 should be completed by 2024.21
SEWERS
The New York City sewer system, first constructed in downtown Manhattan in 1849, now comprises approximately 7,500 miles of sewer pipes crisscrossing the five boroughs.22 Today, the DEP works to maintain, refurbish, and replace sewer assets while also planning for long-term sustainability in a city facing increased rainfall and sea level rise from climate change.23
- In the last two years, the rate of sewer replacement increased—from an average of 17.5 miles of sewers constructed and reconstructed from FY 2013–16 to an average of 24.1 miles in FY 2017 and FY 2018.
- However, the sewer replacement rate is still considerably below what it was from FY 2000–2008, when an average of 38 miles was replaced each year.
- The average sewer backup resolution time has fallen over the last decade, from 5.6 hours in FY 2009, to 4.4 hours in FY 2013, to just 3.7 hours in FY 2018.24
.jpg)
Source: Mayor’s Management Report, FY 2000–2018
CITY AGENCY CAPITAL NEEDS
In the first Caution Ahead report, CUF examined the overall state of good repair needs of the city agencies which report those needs to the Mayor’s Office of Management and Budget (OMB) as part of the Asset Information Management System (AIMS) report. As in the 2014 report, we focus on the library systems and CUNY separately. Here, we review and update the costs of bringing the eighteen city agencies’ aging infrastructure to a state-of-good-repair, meaning the cost for existing agency assets to be repaired, replaced, or rehabilitated so that they are fully functioning.25 Since 2014, those costs have risen dramatically. The good news is that allocated funding has risen as well, though significant gaps remain.
- Since 2013, the four-year state-of-good-repair needs at eighteen city agencies increased by 18.7 percent, from $6.591 billion to $7.825 billion, adjusted for inflation.
- The five agencies with the greatest needs are the Departments of Transportation ($3.3 billion), Education ($2.1 billion), Parks and Recreation ($589 million), Correction ($474 million), and the Health and Hospitals Corporation ($319 million).
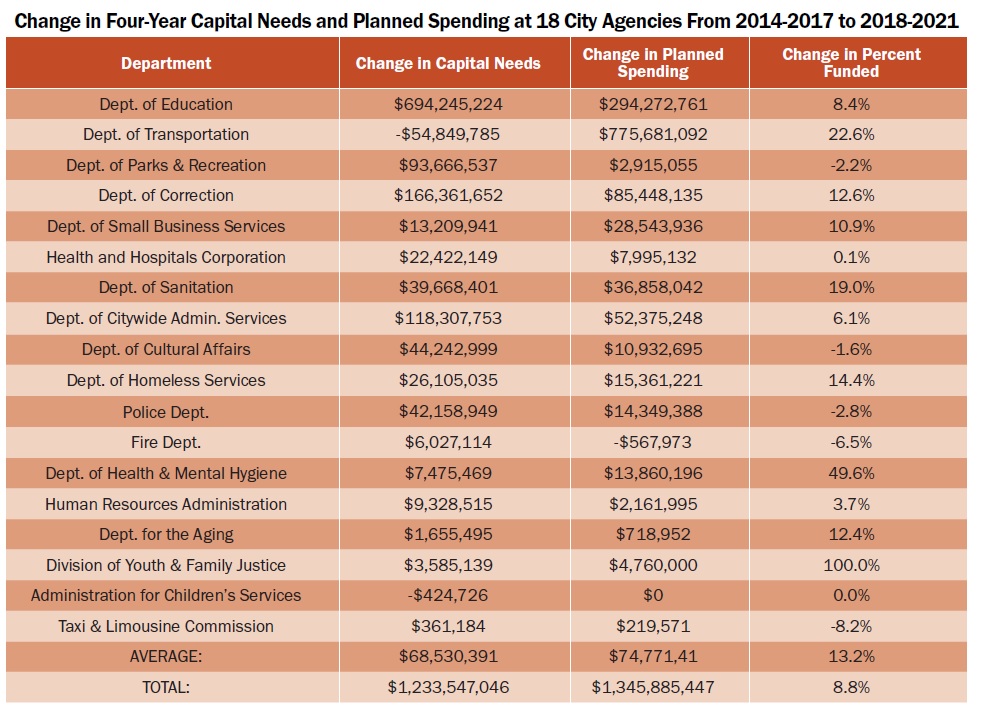
- While needs have grown, so has the city’s commitment to spending. Planned spending across the eighteen agencies increased from $3.1 billion in 2013 to $4.4 billion today, a 40 percent increase in funding.
- Fourteen of the eighteen agencies had less than 40 percent of their needs funded. Five of the eighteen had less than 20 percent funded.
- Six agencies have a capital needs gap of at least $100 million. At DOE, there is a funding gap of $1.5 billion. At the Parks Department, there is a funding gap of $500 million. At the Corrections Department, the gap is $341 million.
- The average funding gap across the agencies has remained stable, at approximately $200 million when adjusted for inflation.26
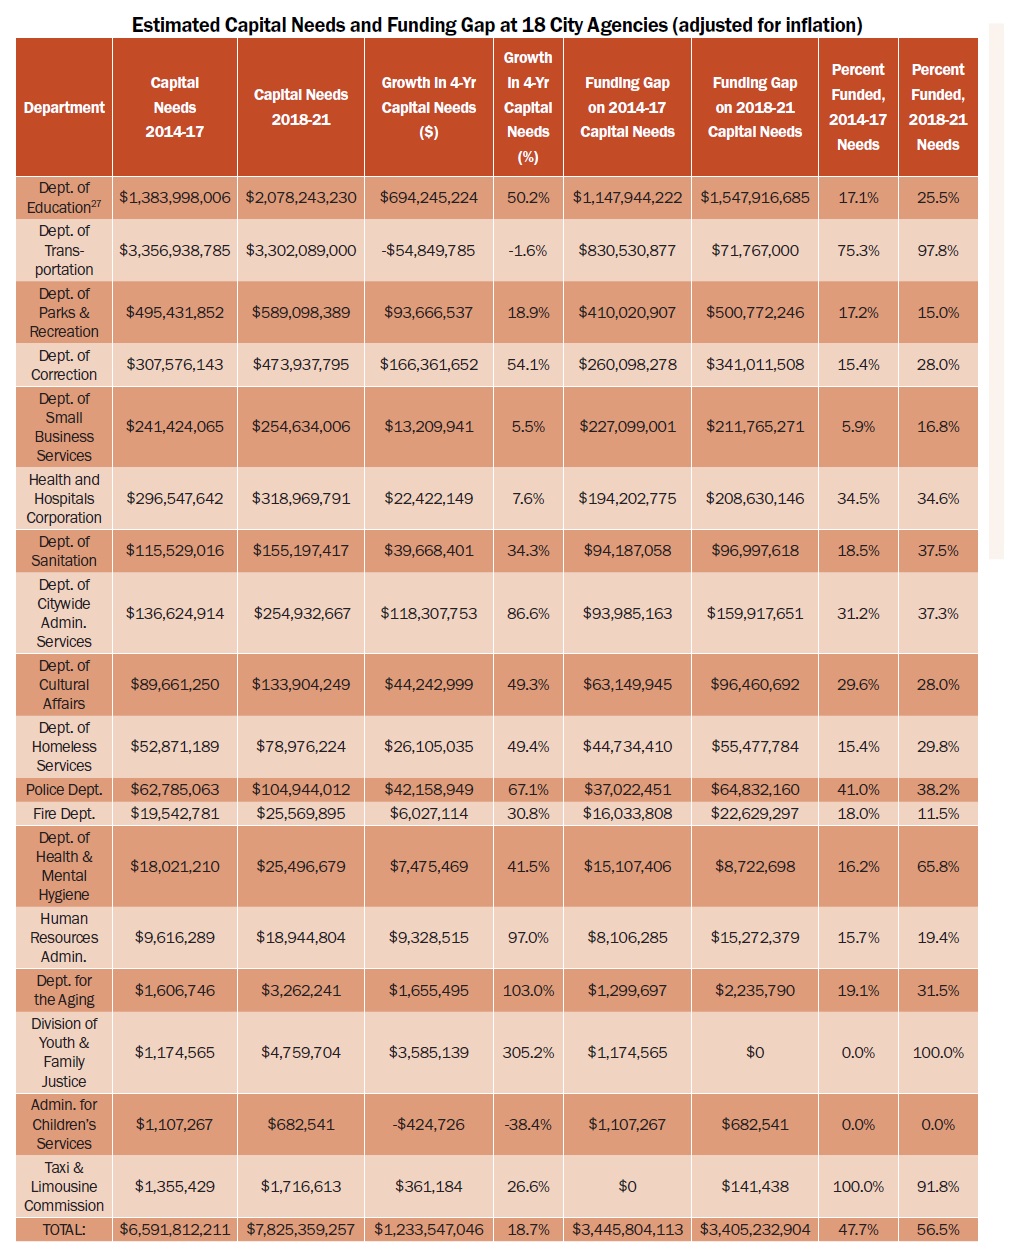
Source: City of New York Office of Management and Budget, Asset Information Management System (AIMS) Report, Agency Reconciliation, FY 2013 and FY 2017
Source: City of New York Office of Management and Budget, Asset Information Management System (AIMS) Report, Agency Reconciliation, FY 2013 and FY 2017
.jpg)
Source: City of New York Office of Management and Budget, Asset Information Management System (AIMS) Report, Agency Reconciliation, FY 2004–17
.jpg)
Source: City of New York Office of Management and Budget, Asset Information Management System (AIMS) Report, Agency Reconciliation, FY 2004–17
.jpg)
Source: City of New York Office of Management and Budget, Asset Information Management System (AIMS) Report, Agency Reconciliation, FY 2004–17
.jpg)
Source: City of New York Office of Management and Budget, Asset Information Management System (AIMS) Report, Agency Reconciliation, FY 2004–17
.jpg)
Source: Blau, Reuven “Libraries Face Nearly 900 Million Shortfall to Fix Aging Buildings,” The City, May 14, 2019
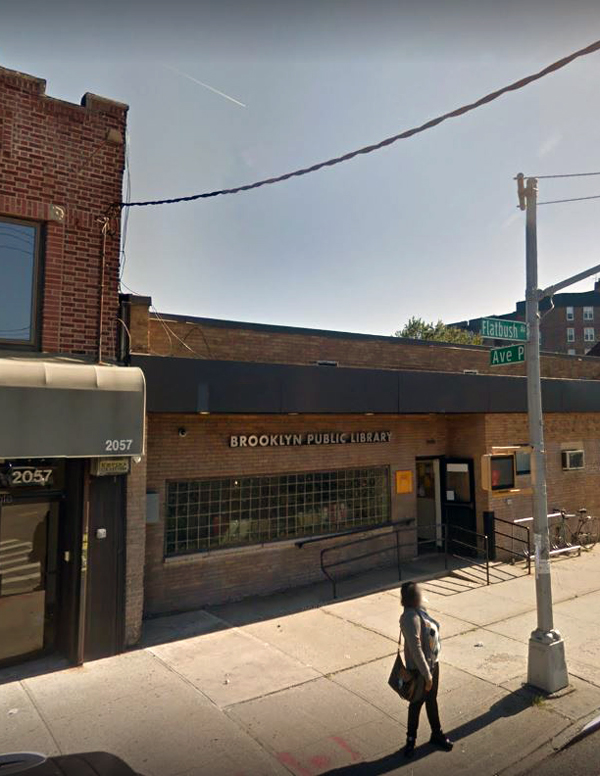
LIBRARIES
When CUF last assessed the capital needs of the city’s three library systems, in June 2018, our analysis showed a total of at least $947 million just to bring their 216 branches and four research centers up to a state of good repair.28 Since then, new funding from the mayor, City Council, and borough presidents has helped the systems chip away at this enormous figure. But in the most recent assessment from 2019, published by The City, the remaining ten-year capital needs still total $896 million.29 That’s on top of emergency capital needs of more than $430 million.30
- New York Public Library (NYPL) has requested $397 million in new capital needs funding in their 2019 ten-year look ahead, including over $118 million in comprehensive renovations to five branch libraries, and over $243 million in project shortfalls and state-of-good-repair projects.31
- Queens Public Library (QPL) has nearly $252 million in unfunded capital needs related to refurbishing, renovation, and branch replacement.
- Brooklyn Public Library (BPL) has a capital shortfall of $227 million.32 With the BPL already dedicating over $110 million to a planned comprehensive branch overhaul for five aging branch libraries, this massive amount of unmet funding will likely affect critical state-of-good-repair needs throughout the rest of the system.
- Our analysis found that, across the three systems, the average library building is now approximately 65 years old.
- Many of New York City’s branch libraries were donated by Andrew Carnegie and date back to the turn of the twentieth century. Eighteen BPL branches, eight QPL branches, and 43 NYPL branches are over 100 years old. While many branch libraries, especially in Manhattan, have received extensive renovations in recent years, other branches in the outer borough systems have full-scale renovations planned over the next several years.33
SCHOOLS
New York City’s school system is the largest in the country, serving over 1.1 million students.34 Since 2011, the NYC Department of Education (DOE)’s state-of-good-repair needs have more than doubled. But while needs are rising, funding has grown with it—from 2014 to 2016, the city funded 100 percent of the DOE’s four-year state-of-good-repair capital needs; in 2017’s updated estimate, 94 percent of these needs were funded.
However, those percentages may not capture the full picture. To better understand the DOE’s work to meet its exploding repair needs, we analyzed the planned activities tracked individually in the AIMS report. Looking solely at those activities and not including capital upgrades and modernizations, we found that since 2011, activities to address line-item state-of-good-repair needs have met an average of just 24 percent of the total required for a state of good repair. In 2017, though the DOE faced nearly $2.1 billion in state of good repair needs, the department’s planned activities addressed only 26 percent ($530 million) of those needs, leaving a funding gap of over $1.5 billion.
- At city schools, state-of-good-repair needs increased by 58 percent since Caution Ahead, from $1.38 billion in 2013 to $2.08 billion in 2017, adjusted for inflation.
- While planned spending has increased to address escalating needs, from an inflation-adjusted $235 million in 2011 to $530 million in 2017, the funding gap is still considerable. The share of needs which are funded has increased just 5 percent, from 21 percent in 2013 to 26 percent in 2017.
- This minor increase in the share of needs which are funded—while the needs themselves have doubled from 2011 to 2017—has resulted in the overall capital shortfall growing from $865 million in 2011 to over $1.5 billion in 2017, adjusted for inflation.35
.jpg)
Source: City of New York Office of Management and Budget, Asset Information Management System (AIMS) Report, Agency Reconciliation, FY 2011–17
CUNY
In 2007, CUNY commissioned a comprehensive audit of its aging infrastructure, finding a $1.7 billion backlog of much-needed repairs; in 2012, a follow-up study was performed, finding that that number had risen to $2.5 billion.
Although no system-wide study of CUNY’s infrastructure has been published since 2012, CUF has analyzed the state-of-good-repair capital needs that are reported to the Office of Management and Budget (OMB) through the AIMS report in order to gauge the relative state of disrepair across the system. Our analysis shows:
- CUNY’s state-of-good-repair capital needs have more than doubled since 2011,from $47.6 million in 2011 to $100.8 million in 2017, adjusted for inflation.
- The gap between capital needs and planned spending has grown significantly. While CUNY’s needs have risen by $53 million since 2011, funding has increased just $12.1 million, from $14.9 million in 2011 to $27 million in 2017, adjusted for inflation.36
- The number of CUNY buildings that are more than 75 years old has risen by 26 percent, from 69 in 2014 to 87 today.
- The number of CUNY buildings that are more than 45 years old has risen by 15 percent, from 153 in 2014 to 176 today.37
.jpg)
Source: City University of New York, Significant Statistics Fall 2018
.jpg)
Source: City of New York Office of Management and Budget, Asset Information Management System (AIMS) Report, Agency Reconciliation, FY 2004–17
SUSTAINABILITY AND RESILIENCY
In this 2019 update to Caution Ahead, CUF has added an examination of the data behind select key sustainability efforts as outlined in the mayor’s OneNYC plan. New York City has set an ambitious target of reducing greenhouse gas emissions by 80 percent by 2050. According to its own estimates, the city is making impressive progress, with citywide annual emissions in 2017 down 17 percent from the 2005 baseline, even as gross city product has increased almost 24 percent and population has grown by 7.6 percent over the same time period.38 But maintaining this pace will require major investment in retrofitting existing buildings to improve efficiency, among other measures. And meeting other targets will require even more ramping up. Work to improve water management, reduce waste to landfills, and protect New York City’s immense coastline encompass major infrastructure challenges. Below, we’ve taken a closer look at a few areas connected with city-owned infrastructure in order to assess progress to date.
GREEN INFRASTRUCTURE
Since taking office, the de Blasio administration has built on the city’s NYC Green Infrastructure Plan by significantly ramping up the construction of green infrastructure, like curbside rain gardens, green roofs, and permeable surfaces in parks and playgrounds, which help to capture stormwater runoff and reduce sewer overflows into waterbodies around the five boroughs. With over 4,000 new assets built or under construction since 2014, the city has recorded remarkable progress.
However, even with this rapid rollout, the city is still struggling to meet the targets set in a 2012 agreement with New York State, which lays out a construction roadmap and sets five-year targets for overall stormwater capture, leading to a goal of 1.67 billion gallons per year in combined sewer overflow reduction by 2030. The city came well under its 2015 target of 507 million gallons, and at the current rate will struggle to meet that amount by the end of 2020, our analysis shows.39
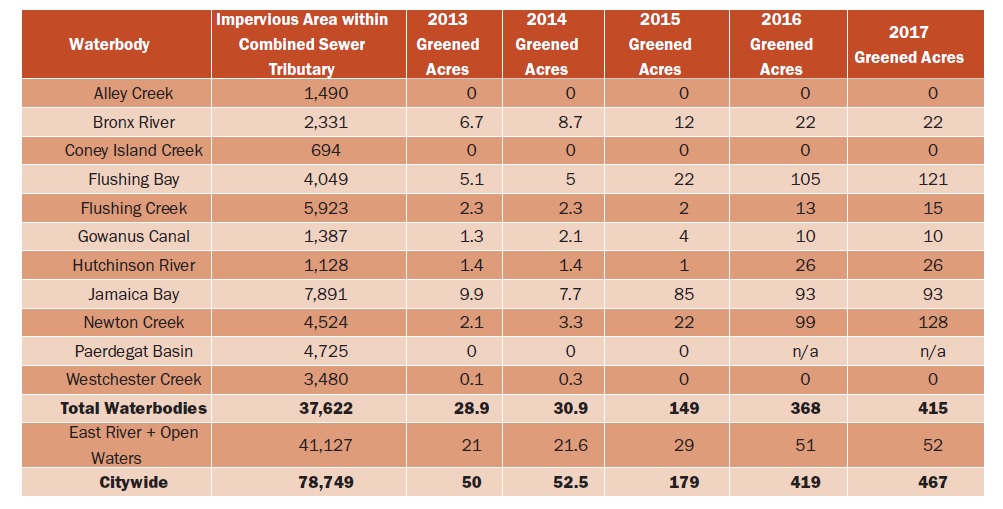
Below, CUF has compiled data on the status of green infrastructure implementation from 2013 to 2017. Our findings show a dramatic increase in green infrastructure since 2014, focused on retrofitting streets, sidewalks, and other public property.
- The number of green infrastructure assets implemented or in construction in 2017 totals 4,316, an increase of over 1500 percent from the 2013 total of 268.
- Those 4,316 assets, which are mostly curbside rain gardens and bioswales, are designed to capture stormwater runoff and divert it away from the sewer system. Altogether, the 4,316 assets capture just under 1.7 million cubic feet of stormwater, which is equivalent to capturing 1 inch of rain onto 467 acres of impervious area, like paved roadways or parking lots.
- There are over 78,000 acres of impervious area across the city, and the city (DEP) and state (NYSDEC) set targets to “green” (capture 1 inch of rainfall) an increasing percentage of this land every five years, ultimately reaching 10 percent greened acreage by 2030.
However, the targets have not been met. Even with the significant construction of green infrastructure in past years—2350 assets in 2016 alone,— the city is still far below its inital 2015 target of 1.5 percent greened area (1181 acres), with only 0.6 percent (467 acres) implemented or under construction in 2017.
.jpg)
Source: NYC Department of Environmental Protection (DEP), NYC Green Infrastructure, 2017 Annual Report
Source: NYC Department of Environmental Protection (DEP), NYC Green Infrastructure, 2017 Annual Report
CARBON FOOTPRINT OF CITY-OWNED BUILDINGS
The city’s overall target of 80 percent reduction of greenhouse gas emissions by 2050 has garnered much attention in recent years. Efforts to reach that target are tracked in a community-scale inventory that encompasses both public and private activity.40 But city government also collects emissions data for over two-thousand city-owned and -leased buildings across the five boroughs, including libraries, schools, and public colleges and universities, in an effort to track and reduce emissions across the city’s municipal infrastructure. For this report, CUF analyzed New York City Government Building Energy Benchmarking Results to see how the carbon footprint of 1,943 municipal buildings, measured in kilograms of carbon dioxide emitted per square foot (kg CO2e/ft2), changed between 2014 and 2017.
- In each of the five boroughs, the average city building’s carbon footprint decreased. The citywide average carbon footprint dropped from 7.02 kg CO2e/ft2 in 2014 to 6.58 kg CO2e/ft2 in 2017, a reduction of 6.3 percent.
- Across New York City, 70 percent of city-owned buildings reduced their carbon footprint.
- Staten Island led the charge in reductions, with 83 percent of the borough’s city-owned buildings reducing their carbon footprint, resulting in a 12 percent decrease in the carbon footprint of the average building.
- Despite the progress, 27 percent of city-owned buildings across the five boroughs saw increases in their carbon footprint between 2014 and 2017, showing unequal progress across the building stock.41
.jpg)
Source: NYC Department of Finance, New York City Government Building Energy Benchmarking Results, 2014–17
.jpg)
Source: NYC Department of Finance, New York City Government Building Energy Benchmarking Results, 2014–17
NYCHA
Nearly 7 percent of New York City’s residents live in New York City Housing Authority (NYCHA) housing, occupying 173,762 apartments in 2,351 buildings across 316 developments in all five boroughs.42 Addressing NYCHA’s infrastructure needs—which are so severe that the housing authority’s units scored 13 percent worse than the national average on inspection scores conducted by the U.S. Department of Housing and Urban Development (HUD)—will require a major new multi-year capital commitment.43
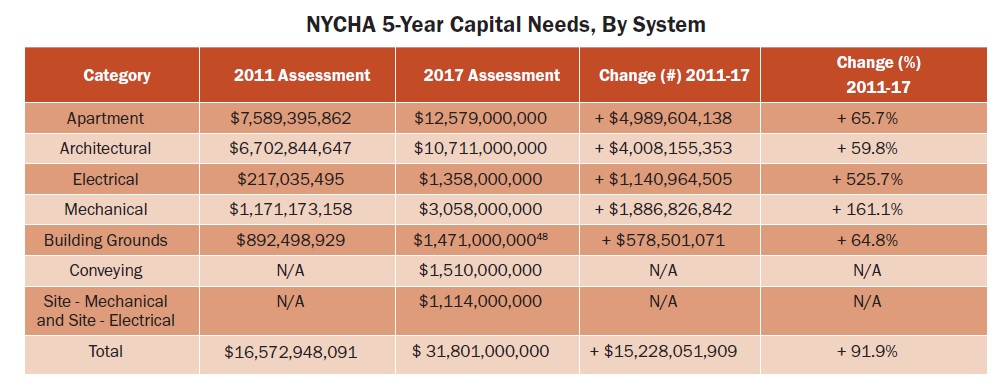
- In its 2011 physical needs assessment, NYCHA had $18 billion in five-year system-wide capital needs, adjusted for inflation. In the most recent assessment in 2017, those needs have nearly doubled, climbing all the way to $31.8 billion. As of 2017, $12.58 billion is needed to rehabilitate NYCHA’s apartments alone.44
- NYCHA reported a capital shortfall of $14.6 billion in their 2013-2017 capital plan, adjusted for inflation; in their 2018-2022 plan, the unfunded capital needs for NYCHA’s buildings reached $16.5 billion.45
- Every year, HUD’s Real Estate Assessment Center conducts inspections of properties that are owned, insured, or subsidized by HUD—CUF analyzed a database of these scores. In 2018, the average physical inspection score for NYCHA properties was 72, while the average across the entire national database was 83.46
- NYCHA’s developments with the greatest needs are in far worse shape. In 2011, the lowest inspection score for a NYCHA development was 39 out of 100. In 2017, the development in the worst shape, Stanley Isaacs, received a score of just 25.
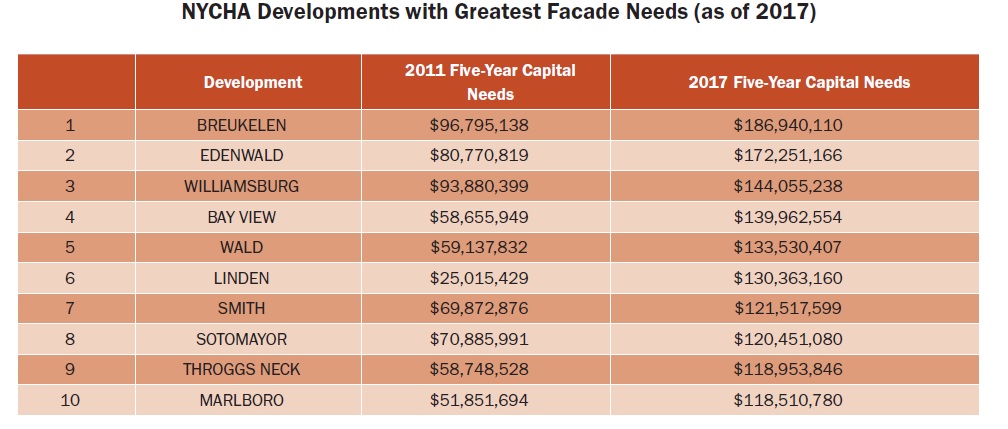
- As of 2011, eleven NYCHA developments had over $70 million in five-year facade repair needs; according to the 2017 assessment, there are now 50 developments facing over $70 million in five-year facade repair needs.
- In 2011, just two developments, Pomonok ($124 million) and Ravenswood ($108 million), had over $100 million in five-year facade repair needs. Those developments have seen major investment and now record just $73 million and $65 million in facade needs, respectively.
- But as of 2017, there are nineteen developments with over $100 million in five-year facade repair needs.
- In 2011, the average total five-year facade repair needs for a NYCHA development was $19.7 million; as of 2017, the average needs reached $33 million.47
.jpg)
Source: HUD Real Estate Assessment Center, Public Housing Physical Inspection Scores, 2018
.jpg)
Source: NYCHA Physical Needs Assessment, 2011 and 2017
Source: NYCHA Physical Needs Assessment, 2017
Source: NYCHA Five Year Capital Plan, Calendar Years 2011–2015
NEW YORK CITY TRANSIT
In the five years since CUF last took stock of the city’s transportation infrastructure, the subway system has been mired in a crisis brought on by years of chronic underinvestment. The crisis peaked with a train derailment in June 2017 which injured 34 people, after which Governor Cuomo declared a state of emergency for the New York subway system. This declaration was supposed to encourage the MTA to modernize the system and get it into a state of good repair. But the gap between funding and need is still immense, even as the system continues to experience frequent delays and other problems. The first five years of the Fast Forward Plan, released in May 2018, calls for an estimated $19 billion in new investment, which would come on top of preexisting NYC Transit capital needs of $16.3 billion for 2015–2019.49 We reviewed the most recently available full-scale needs assessment alongside the updated MTA capital budget in order to assess where planned spending is keeping pace or falling short.
- Fully implementing the Fast Forward plan to modernize the system will cost an estimated $40 billion over ten years. To date, no new funds have been allocated toward that plan.
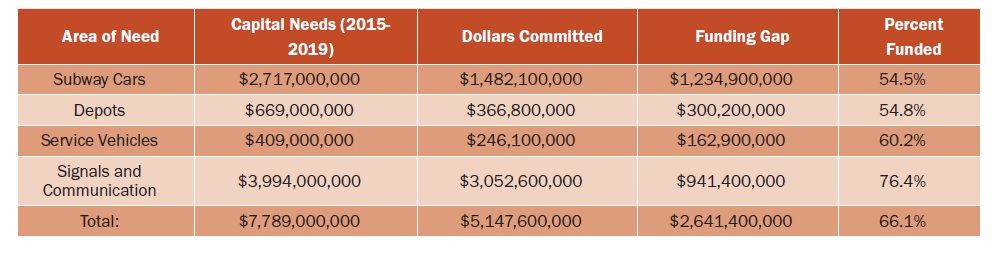
- Apart from the Fast Forward plan, NYC Transit faces significant capital needs that have not been met for the 2015–2019 portion of the 20-Year Capital Needs Assessment.50 Subway cars, bus depots, and service vehicles face a significant funding shortfall totaling over $1.7 billion.
- Several investment areas, including signals and communications, subway cars, buses, tracks, and passengers stations) will require a total of more than $45 billion of investment over the 20-year span.
- To date, 76.4 percent of the signals and communications systems’ needs are funded—over $3 billion in the latest budget. But due to the enormous needs facing these systems, signals and communications still face a funding gap of just under $1 billion. At this rate of investment, the funding gap facing these vital systems could balloon to $4.3 billion by 2034. The greatest gap between the MTA’s most recent five-year capital plan and its most recent needs assessment is in capital funding for subway cars. Only 54.5 percent of subway car capital needs are met, leaving a funding gap of over $1.2 billion.27 As these needs grow over the next decade and a half, this gap could expand to $3.8 billion, if funding continues to cover just over half of projected needs.
- Keeping up with the replacement of subway cars is critical. Over 42 percent of subway cars are over thirty years old. 15 percent were manufactured before 1975.
Source: MTA Twenty-Year Capital Needs Assessment 2015-2034
APPENDIX
.jpg)
Source: City of New York Adopted Capital Commitment Plan, FY2014
.jpg)
Source: City of New York Adopted Capital Commitment Plan, FY2019
ENDNOTES
- City of New York Adopted Capital Budget, FY 2015 and FY 2020
- Mayor’s Management Report, FY 2000–2018
- City of New York Office of Management and Budget, Asset Information Management System (AIMS)
- New York City Housing Authority (NYCHA) Five Year Capital Plan, Calendar Years 2011– 2015; NYCHA Physical Needs Assessment 2017
- Mayor’s Management Report, FY 2009–18, Preliminary Mayor’s Management Report, FY 2019
- New York State Department of Transportation (NYSDOT) Bridge Conditions, https://data.ny.gov/Transportation/Bridge- Conditions-NYS-Department-of-Transportation/wpyb-cjy8, accessed February 19, 2019
- Save Our Bridges data on Structurally Deficient and Fracture Critical Bridges, http:/saveourbridges.com/,accessed May 17, 2019
- Office of the Mayor, “Mayor de Blasio Announces Record Repaving as DOT Exceeds Fiscal Year Target,” June 10, 2017, https:/www1.nyc.gov/office-of-the-mayor/news/46717/mayor-de-blasio-record-repaving-dotexceeds-fiscal-year-target, accessed August 6, 2019
- Mayor’s Management Report, FY 2000–2018; Preliminary Mayor’s Management Report FY2019
- Center for an Urban Future (CUF), Caution Ahead
- Mayor’s Management Report, FY 2000–2018
- NYSDOT, Pavement Data Report Region 11, 2017
- NYS DOT Bridge Conditions, https://data ny.gov/Transportation/Bridge-ConditionsNYS-Department-of-Transportation/wpyb cjy8, accessed February 19, 2019
- Save Our Bridges data on Structurally Deficient and Fracture Critical Bridges, http:/saveourbridges.com/,accessed May 17, 2019
- Federal Highway Administration, “Clarification of Requirements for Fracture Critical Members,” https://www.fhwa.dot.gov bridge/120620.cfm, Accessed August 6, 2019
- New York City Underground Infrastructure Working Group Report (2014)
- New York Municipal Water Authority, Consulting Engineer’s Report, FY2019
- Mayor’s Management Report, FY 2003–18
- Mayor’s Management Report, FY 2003–18
- New York Municipal Water Authority, Consulting Engineer’s Reports FY 2014-2017; Dwyer, Jim “De Blasio Postpones Work on Crucial Water Tunnel,” April 5, 2016
- City of New York Ten-Year Capital Strategy, FY 2020–2029
- New York Municipal Water Authority, Consulting Engineer’s Report, 2019
- NYC Department of Environmental Protection (DEP), 2018 Strategic Plan
- Mayor’s Management Report, FY 2000–2018
- These estimates of state of good repair needs do not fully capture the capital investment required to fully repair all assets. Many classes of assets, such as agency vehicles and water and sewer assets are not included in these estimates. Further, agencies only submit condition assessments and maintenance schedules for capital assets with a replacement cost of at least $10 million and a useful life in excess of ten years meaning that many assets are excluded, and that these figures represent a significant underreporting of the total capital needs for any given agency. Caution Ahead notes, for example that “the AIMS assessment calculated the cost of rehabilitating six AIMS assessment calculated the cost of rehabilitating six City University of New York (CUNY) community colleges at $66 million, but a more rigorous assessment commissioned by CUNY itself put the capital backlog at $731 million, 11 times greater.”
- City of New York Office of Management and Budget, Asset Information Management System (AIMS) Report, Agency Reconciliation, FY 2017
- Includes only line-item planned activities for state of good repair needs listed in the AIMS report, not upgrades and modernizations
- CUF, “New York City’s Libraries Still Face Daunting Capital Needs,” https://nycfuture. org/research/new-york-citys-libraries-still- face-daunting-capital-needs, accessed August 6, 2019
- Blau, Reuven “Libraries Face Nearly 900 Million Shortfall to Fix Aging Buildings,” The City, May 14, 2019
- CUF, “New York City’s Libraries Still Face Daunting Capital Needs,” https://nycfuture. org/research/new-york-citys-libraries-still- face-daunting-capital-needs, accessed August 6, 2019
- The New York Public Library 10-Year Look Ahead, https://www.documentcloud. org/documents/5996427-NYPL-Capital-New- Needs-Info.html, accessed August 6, 2019
- Blau, Reuven “Libraries Face Nearly 900 Million Shortfall to Fix Aging Buildings,” The City, May 14, 2019
- Brooklyn Public Library, Strategic Plan 2018
- NYC Department of Education (DOE), “DOE Data at a Glance,” https://www.schools.nyc/gov/about-us/reports/doe-data-at-a-glance, accessed August 6, 2019
- City of New York Office of Management and Budget, Asset Information Management System (AIMS) Report, Agency Reconciliation, FY 2011–17
- City of New York Office of Management and Budget, Asset Information Management System (AIMS) Report, Agency Reconciliation, FY 2011–17
- City University of New York (CUNY), Significant Statistics Fall 2018
- Mayor’s Office of Sustainability, Inventory of New York City Greenhouse Gas Emissions, https://nyc-ghg-inventory.cusp.nyu.edu, accessed August 6, 2019
- DEP, NYC Green Infrastructure, 2017 Annual Report
- Mayor’s Office of Sustainability, New York City’s Roadmap to 80 X 50
- NYC New York City Government Building Energy Benchmarking Results, 2014–2017
- NYCHA, NYCHA 2019 Fact Sheet
- U.S. Department of Housing and Urban Development (HUD) Real Estate Assessment Center, Public Housing Physical Inspection Scores, 2018, https://www.huduser.gov/portal/datasets/pis.html#2018, accessed February 6, 2019
- NYCHA, NYCHA Physical Needs Assessment, 2011 and 2017
- NYCHA, “Five Year Capital Plan Calendar Years 2013–2017”; NYCHA, “Five Year Capital Plan Calendar Years 2018–2022”
- CUF analysis of data from HUD Real Estate Assessment Center, Public Housing Physical Inspection Scores, 2018
- NYCHA, NYCHA Physical Needs Assessment, 2011 and 2017
- In NYCHA’s 2017 Physical Needs Assessment, the category “Site – Architectural” replaces “Building Grounds.”
- Fitzsimmons, Emma “A Sweeping Plan to Fix the Subways Comes With a $19 Billion PriceTag,” New York Times, May 22, 2018
- Metropolitan Transit Authority (MTA), MTA Twenty-Year Capital Needs Assessment 2015– 2034
- MTA, MTA Capital Program 2015–2019, Amendment No. 3, April 2018